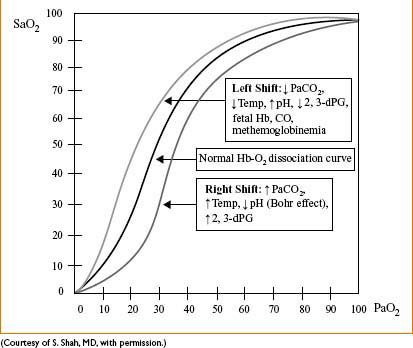
Figure 7-1. The hemoglobin-oxygen (Hb-O2) dissociation curve.
NONINVASIVE BLOOD PRESSURE MONITORING (OSCILLOMETRIC SPHYGMOMANOMETRY)
Basis: Air cuff inflated around extremity, transducer reads oscillations from systolic pulsation
• Inflation pressure raised above systolic & then deflated until oscillations appear
• Max amplitude of oscillations = systolic; min amplitude of oscillations = diastolic
• Waveforms analyzed by software, not displayed (each device has its own algorithm)
Causes of Artifacts
• Movement, obesity, poor perfusion, hypotension, extreme hypertension, bradycardia
• Wrong cuff size: Too small cuff gives ↑ pressure reading
• Irregular pulse: A. fib, PVCs, pulsus bisferiens (hypertrophic cardiomyopathy), pulsus alternans (pericardial effusion), pulsus paradoxus (tamponade), pulsus parvus et tardus (aortic stenosis)
Complications
• Skin necrosis, soft tissue injury, phlebitis, neuropathy (peroneal, radial), compartment syndrome (biceps), petechiae, bruising, IV line infiltration/occlusion, interference with pulse oximetry
TEMPERATURE MONITORING
Basis: Thermistors (resistors with resistance inversely proportional to temperature) quantify temperature
Complications of Hyperthermia
• More rapid and less predictable drug clearance
• Cellular & metabolic derangements (hypercarbia, acidosis)
• CNS more vulnerable to injury when warm as opposed to cool
Complications of Hypothermia (below 36°C)
• ↑ Length of stay, ↑ wound infections, coag. problems, ↑ shivering, ↑ dysrhythmias, ↑ morbid cardiac events, ↑ intraoperative blood loss, ↑ allogeneic transfusion requirement, ↑ norepinephrine, ↑ shivering, ↑ thermal discomfort, ↑ length of PACU stay
Artifacts: Related to probe placement (core temperature vs. peripheral)
Hazards: Trauma (from probe placement), infection, shock (from grounded equipment)
Placement: “Core temp” (esophageal, PA) more meaningful than “shell temp” (rectum, axilla)
Malignant Hyperthermia
• Temp ↑ of 0.5°C in 15 min is significant & should raise concern
• Early dantrolene administration is the only effective therapy (see Appendix C)
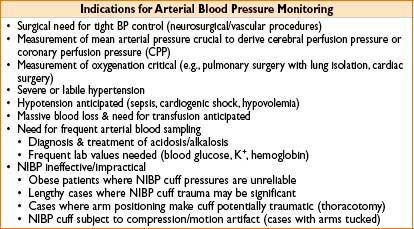
ARTERIAL BLOOD PRESSURE (ABP) MONITORING
Basis: Circulatory tree—intra-arterial catheter—fluid–transducer mechanical system
• Modeled by differential equation: Includes natural frequency & damping ratio
• Damping ratio <1, underdamped, “ringing” waveform results
• Damping ratio =1, critically damped, no ringing & fidelity preserved
• Damping ratio >1, overdamped, poor fidelity, lose high-freq info (i.e., dicrotic notch)
• Longer & thinner tubing, ↑ viscosity, kinks & bends: All cause ↑ resistance & damping
• Arterial waveform has higher-freq info closer to aorta (↑ damping along distal arteries)
• Central (e.g., femoral) A-line better than radial for conveying high-freq info
• Mechanics of A-line transducer system:
• Short, rigid tubing with incompressible fluid (saline) typically used (↓ damping effect)
• Strain gauge attached to a diaphragm changes resistance with tension (pressure)
• Wheatstone bridge “amplifies” change in resistance & is calibrated
• High frequency of mech. system → greater measurement accuracy
• Dense fluid raises frequency of system → greater accuracy (saline better than air; blood better than saline)
• Sources of signal degradation
• Excess tubing length, too thin tubing caliber, excess fittings (stopcocks), large air bubbles (slow frequency response & increase in damping ratio)
• Height can cause increase/decrease in A-line reading: 12″ transducer drop = 22.4 mm Hg increase in pressure displayed
SAFELY FLUSHING AN ARTERIAL LINE
• Turn stopcock (up usually) so that the transducer is opened to air
• Flush Luer-Lock to clear it of blood (hold gauze by stopcock to catch blood)
• Turn stopcock so that the handle is horizontal (i.e., in starting position)
• In short bursts of 2 sec or less, pull rubber line or squeeze valve to flush line back toward pt
• Ensure that the entire line is eventually cleared of blood (no bubbles present)
• If line is flushed continuously (not in 2 sec bursts), the artery may fill with saline & flow retrograde (transducer pressure head is 300 mm Hg) to aortic arch & embolize (saline/air) to common carotid & brain
HAZARDS OF ARTERIAL LINE MONITORING
• Embolization: From flush mechanism; limit flush <2 sec to prevent retrograde flow
• Thrombosis: Risk ↑ with duration of placement; catastrophic if end artery (brachial)
• Nerve injury: Nerves closely related to arteries anatomically
• Vascular injury: AV fistula, hematoma, dissection, retained catheter or wire, femoral artery injury leading to hypotension and major morbidity
• Limb loss: Inadvertent drug injection (i.e., thiopental, phenergan) → severe vascular injury → amputation or chronic pain syndrome as sequelae
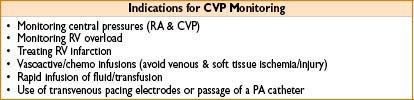
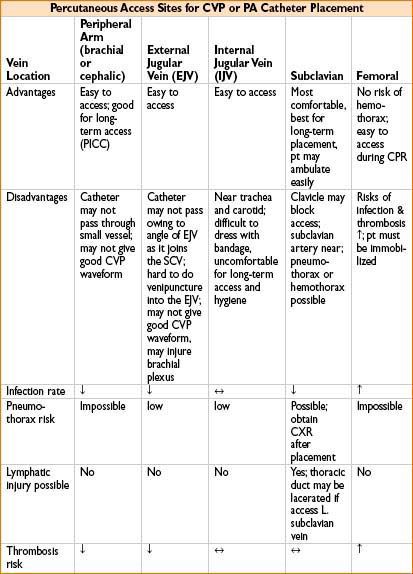
CENTRAL VENOUS LINES & CENTRAL VENOUS PRESSURE (CVP) MONITORING
Uses: Monitoring (CVP & central blood O2 saturation—surrogate for SvO2). Central drug/fluid/blood product administration (may be safer route for vasoactives). Renal replacement therapy (CVVH/HD) & temporary pacemaker lead placement
Hazards of Central Line Placement
• Pneumothorax, hemothorax, thrombus, thromboembolus
• Arterial puncture, hematoma, AV fistula formation
• Brachial plexus or nerve injury
• Infection including systemic sepsis, septic thrombus, endocarditis
• Knotting or breakage of catheter, retained wire, erosion through vessel, endocardium, myocardium
• Thoracic duct injury, chylothorax
• Microshock, dysrhythmias
Artifacts
• Positioning: (e.g., jackknife) may affect CVP
• Abdominal compression/retraction may impede CVP & blood return
• Insufflation of CO2 in abdomen (laparoscopy) may artifactually raise CVP
• Rapid infusion of IVF may artifactually raise CVP
• AV fistula in the arm may cause artifactually high CVP
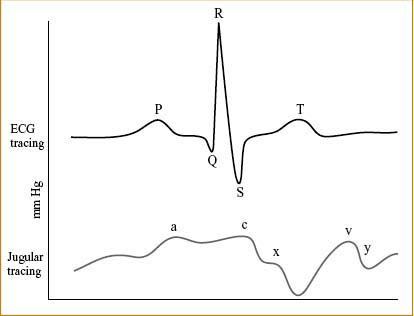
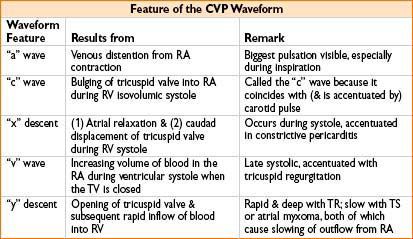
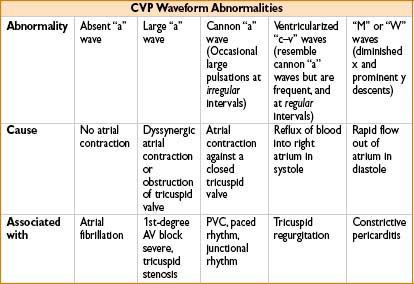
NORMAL CVP & CORRESPONDING ECG WAVEFORM (FIG. 7-2)
Figure 7-2. CVP waveform placed in synchrony with the ECG waveform.
MEASUREMENT OF CARDIAC OUTPUT (ALSO SEE APPENDIX A)
• Fick equation: CO = VO2 ÷ (CaO2 – CvO2) where:
• VO2 = oxygen consumption = uptake of O2 from inspired gases in L/min
• CaO2 = content of O2 in arterial blood in liters O2/L blood
• CvO2 = content of O2 in venous blood in liters O2/L blood
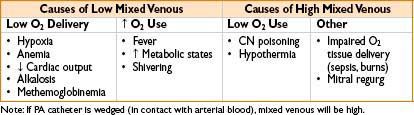
• Mixed venous O2 saturation (SvO2):
• Gives an indication of tissue oxygenation
• Normal SvO2 is 75% (range 60–80%); higher under anesthesia, up to 90%
• CaO2 (in mL/L blood) = [13.4 × Hb conc. (in mg/dL) × SaO2 /100] + [0.031 × PaO2 (in mm Hg)]
• CvO2 (in mL/L blood) = [13.4 × Hb conc. (in mg/dL) × SvO2 /100] + [0.031 × PvO2 (in mm Hg)]
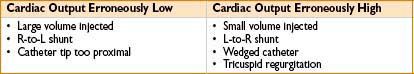
• Thermodilution technique
• Ensure tip of catheter is in main pulmonary artery
• Quickly inject 10 mL of cold saline or 5% D5W into CVP port
• Thermistor monitors temp change & reports area under curve
CONSIDERATIONS FOR PA THERMODILUTION CATHETER INSERTION & MONITORING
• Decision for insertion: Many question utility of PA measurement, majority of clinicians untrained or uninformed about basic PA facts and measurements, TEE or TTE may be superior in demonstrating cardiac function, PA carries significant infectious risk
• Risk–benefit analysis critical: Must know what you are seeking to measure
• Filling pressures intraoperatively → to determine exact amount of preload needed
1. Useful in COPD (sensitive to excess fluid), large 3rd-space loss, pulm HTN, RV or LV failure
2. PA looks at LV filling pressures (in addition to RV filling pressures, via CVP)
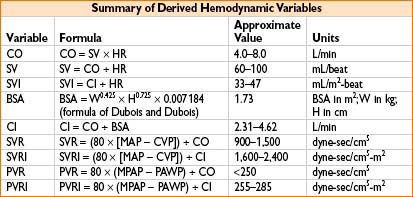
• SVR
1. Liver transplantation where liver dz has caused chronic shunting, SVR ↓
2. Sepsis, SVR may be too ↓ for adequate global perfusion
3. Free flaps/plastic surgery where peripheral cold may make SVR ↑
4. Pressors/inotropes infused where SVR may become too ↑
5. CHF where SVR may be relatively ↑
• Cardiac output (cardiac, CHF, or large fluid cases)
1. Frank–Starling curve (CO as a function of preload) shows if pt is in CHF or hypovolemic
Plot PA diastolic pressure (on x-axis) vs. CO (y-axis) on graph paper
2. Titrate dopamine vs. dobutamine vs. amrinone to improve CO
3. Provide real mixed venous O2 blood sample for assessing O2 saturation & delivery
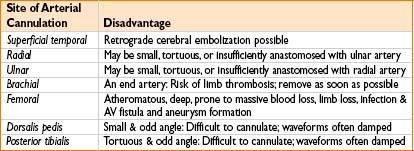
• Insertion site (see the table below)
• Consider passing a PA sheath with obturator (plug) or CVP inserted lumen
Allows later optional PA use if circumstances warrant it (e.g., oliguria, hypotension)
• Tips for PA catheter placement (see Chapter 11, on Procedures in Anesthesia)
• Calibrate carefully (“zeroing”): Decisions regarding LV function depend on a few mm Hg!
• Check balloon & valve to ensure balloon holds air (1 cm) when valve is closed
• Pass to 20 cm depth & assure CVP waveform before inflating (1 mL only) balloon
• Be sure pt is flat, not with head down, when “floating” PA catheter
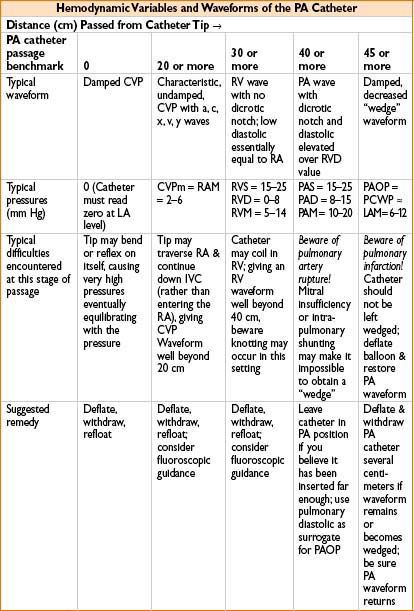
• Know & anticipate waveforms & locations of distal tip
≈20 cm is CVP, may inflate balloon with 1 cm air
≈30 cm is RV, pressure much greater, no dicrotic notch
≈40 is PA, diastolic c several mm Hg ↑ & notch appears
≈45 (near PCWP) some damping & ↑ in pressure will occur:
• Let balloon tip occlude while you very slowly advance catheter
• When you get wedge waveform (see Fig. 7-3), disconnect breathing circuit
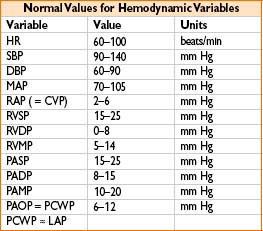
• Read mean PCWP (approximately equivalent to LVEDP; 4–15 mm Hg normal)
• Reconnect circuit, deflate balloon, observe PA waveform return
• Withdraw catheter 1–2 cm for safety & do not reinflate in situ
• If you want another PCWP, safest option is to withdraw to 20 cm & refloat
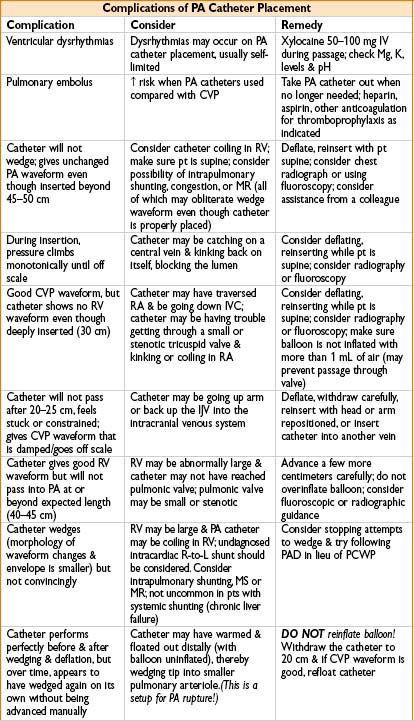
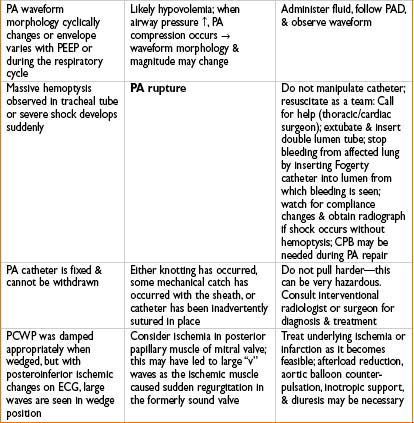
• PA perforation: Likely when no wedge pattern evident after deep insertion
Circumstances that predispose to PA perforation: Papillary muscle ischemia, mitral stenosis or regurgitation, pulm HTN or intrapulmonary shunting, LV failure. Beware: After seeing no definitive wedge pattern, repeated attempts to advance catheter may perforate PA
Many times PA catheter will give a good wedge pattern (the waveform continues to look like PA even though catheter is in PA & ought to have wedged). Beware: Coiling or false negative wedging may occur, predisposing to PA rupture
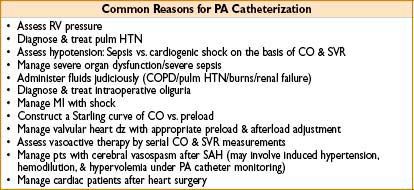
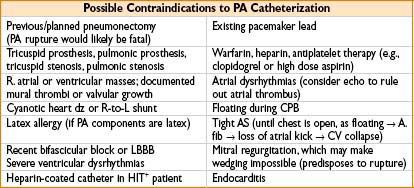
Figure 7-3. Typical waveform progression of PA catheter floating through the cardiac chambers.
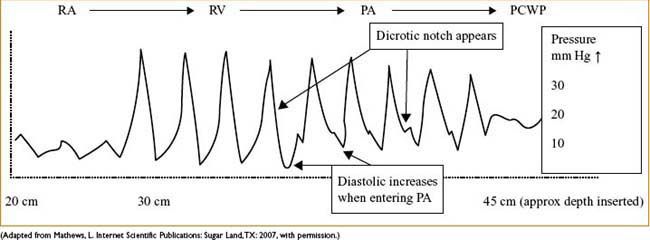
NORMAL PA WAVEFORMS AS CATHETER IS PASSED FROM CVP (RA) TO RV TO PA TO PCWP
“V” WAVES IN A WEDGE TRACING
Usually a sign of severe mitral regurgitation (get transmission of large pressure waves from LV, through incompetent mitral valve, into LA, and pulmonary vessels)
< div class='tao-gold-member'>


