MAGNETIC RESONANCE IMAGING: BASICS
INTRODUCTION
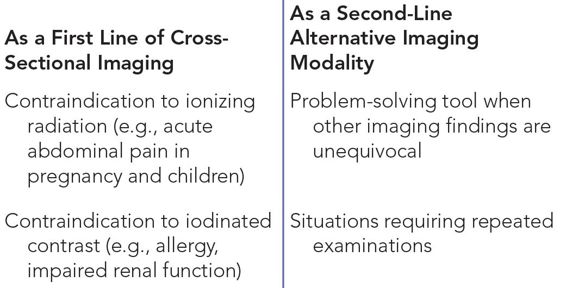
Imaging in an emergency setting demands assessment in the shortest possible time. While computed tomography (CT) scan has been the mainstay of cross-sectional imaging in emergency radiology for its rapid image acquisition, magnetic resonance imaging (MRI) can be useful in the emergency setting as well. MRI, with its inherent superior soft-tissue contrast, is highly sensitive for detection of abnormal fluid or edema, thus obviating the need for contrast agents. Lack of ionizing radiation makes it an obvious choice in the abdominal evaluation in pregnant women, and in the pediatric population. Gadolinium based contrast agents are safer than iodinated contrast agents used in CT.1,2 Furthermore, current refinements in MRI technology have resulted in shorter scanning times, which are particularly suited for emergency indications. MRI is therefore not only being increasingly used as a problem-solving tool, but also as a first-line modality. This chapter outlines the indications for MRI as well as the basic sequences and protocols used with an emphasis on the diagnostic approach to emergencies.
BASIC PRINCIPLES AND INSTRUMENTATION
 Basic Principles
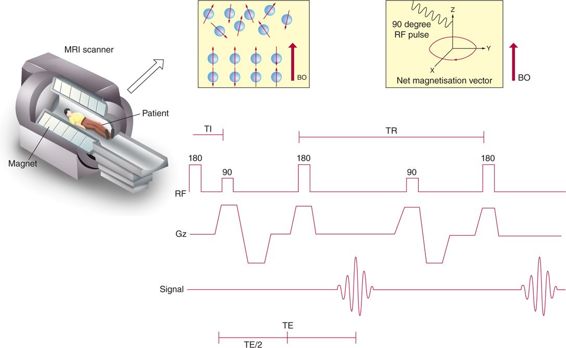
MRI makes use of the fact that water-containing hydrogen nuclei (protons) forms a major constituent of the human body. Every spinning hydrogen proton has a small magnetic field around it. The hydrogen nuclei, to begin with, are randomly placed along their own magnetic field. For the orientation in space, conventionally, Z-axis is considered as the long axis of the patient as well as bore of the magnet. Once inside the magnetic field of the scanner, some of the protons align themselves along the direction of the magnetic field and others anti-parallel to it. When protons align, not only do they rotate or spin around themselves, but also their axis of rotation moves (which is termed “precession”). There are always more protons spinning parallel to the Z-axis than opposite to it. Forces of these protons add to form a magnetic vector along the Z-axis, a process called “longitudinal magnetization.” A radiofrequency current, known as “resonance frequency,” is then applied, which causes the protons to flip. Some of these protons go to a higher energy level and start precessing in an anti-parallel direction, which reduces the magnitude of longitudinal magnetization. The energy of the protons then adds to form a new magnetic vector in the transverse (X-Y) plane. This is called “transverse magnetization.” When the current is switched off, the protons realign. During this period of relaxation, receiver coils measure the generated signal, and then a computer converts the signal to images via a complex process called Fourier transformation (Figure 5–1).
Figure 5–1 Illustration showing mechanism of MRI and basic terminologies like TR (repetition time) and TE (time to echo). [(Illustration courtesy of Lakshmanan Subramanian-Coimbatore, India.)
 Instrumentation
1. Magnet: Magnet strengths of 1.5 Tesla (T) and above are an essential prerequisite for abdominal imaging.
2. Surface coils: Large phased-array coils are preferred, due to a superior signal-to-noise ratio with faster scanning time.
IMAGING PROTOCOLS
Imaging protocols in the emergency setting are aimed at acquiring images of diagnostic quality in the shortest possible time frame.3 Radiologists consider the following parameters in devising MRI protocols:
A. Oral contrast—Dilute barium solution can be used as an oral contrast agent and may be useful in assessment of the biliary tree, pancreatic abnormalities, or bowel pathology.
B. Intravenous contrast—Although intravenous contrast may be not be required in an emergency setting, its use is required to characterize liver lesions, pancreatic necrosis, and adnexal masses, and in MR urography. Gadopentenate dimeglumine is administered as a bolus at a dose of 0.1 mmol/kg at the rate of 2 mL/s, followed by a flush with 20 mL saline at the 2 mL/s. Contraindications to contrast include pregnancy and marked renal impairment (glomerular filtration rate [GFR] <30 mL/min2).
C. Sequences—The key MRI sequences and their applications are summarized in the following and in Table 5–1.
1) Breath-Hold Sequences: Utilized whenever possible.
a) Dual-Echo T1 Sequence: For detection of hemorrhage (hyperintense), air, and calcium (hypointense).
b) Dynamic Post-Contrast Fat-Saturated T1 Sequence: Allows coverage of the liver in 20 to 30 seconds with an interpolated slice thickness of 3 to 4 mm. The upper abdomen is imaged in 3 phases of contrast enhancement: arterial, portal venous, and delayed venous.4
c) T2 Half-Fourier Single-Shot Fast Spin–Echo Sequence (SSFSE/HASTE): Used to image the pancreaticobiliary tree, ascites, pleural effusion, hydronephrosis, and bowel.
2) Free Breathing Sequences: Used in patients who are unable to hold their breath for longer than 20 seconds.5 Sections are obtained at one slice per second in end expiratory phase.
a) Magnetization-Prepared T1 Gradient–Echo Sequences
b) T2 Half-Fourier Single-Shot Fast Spin-Echo Sequence
CLINICAL APPLICATIONS
MRI is often performed as an adjunct to ultrasound or as a first-line cross-sectional modality in an attempt to replace CT. In some cases the initial diagnosis is known, and MRI serves as a tool to better delineate and quantify the extent of pathology. However, in many situations MRI may prove to be more advantageous than other imaging modalities. Tables 5–2 through 5–4 summarize the emergent indications for MRI and the pathology it can elucidate.
Abbreviations: CT, computed tomography; USG, Ultrasonography.
 Liver
Liver
The imaging approach to liver lesions focuses on lesion morphology and enhancement characteristics.
Hepatic Abscess
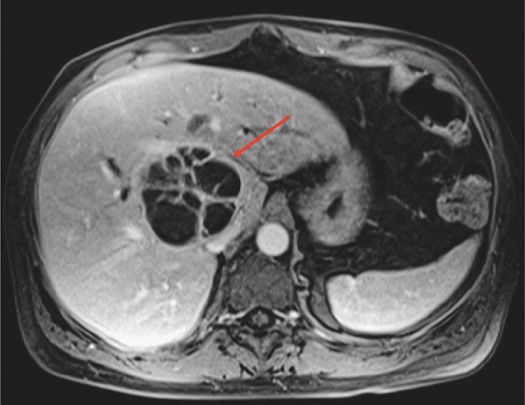
About 80% of liver abscesses are secondary to biliary/hematogenous/direct spread from adjacent organs/trauma, and only 20% are cryptogenic.6 Abscesses may present as either microabscesses (<2 cm), macroabscesses (>2 cm), or in a miliary pattern. The miliary pattern is usually due to staphylococcal infection or a cluster of microabscesses that appear to coalesce focally. They appear as focal, peripherally enhancing lesions that are hypointense on T1– and hyperintense on T2-weighted sequences (Figure 5–2). The abscess wall is often imperceptible on unenhanced scans, but the peripheral enhancement persists on delayed venous phases. The nonspecific finding of perilesional edema with or without transient arterial perilesional enhancement may be present, which manifests as a wedge-shaped area surrounding the abscess.
Figure 5–2 T1-weighted post-contrast axial image showing subtle peripheral enhancement and multiple internal septae in this pyogenic liver abscess (arrow).
Amebic liver abscesses may appear more heterogeneous on T2 and show 1 to 3 layers of concentric rim enhancement.7 MRI ensures a detailed evaluation of the complications such as rupture of abscess into the peritoneum/pleura. Amebic empyema is seen as hyperintense fluid in pleural cavity on both T1- and T2-weighted images (WI). Decrease in perilesional edema and formation of concentric rings in the abscess wall are indications of treatment response.
MRI has been found to be superior to CT in the evaluation of fungal abscesses.8 Fungal abscesses are usually seen in the immunocompromised and appear as microabscesses less than 1 cm in diameter that do not enhance in the early stage of disease. Peripheral enhancement occurs only in the subacute phase. Abscesses show restricted diffusion, appearing bright on diffusion-weighted sequences and hypointense on apparent diffusion coefficient (ADC). ADC is the quantitative estimation of magnitude of diffusion of water molecules within tissues. ADC values can be measured by drawing regions of interest (ROIs) on the tissue under consideration on an ADC image.
Acute Hepatitis
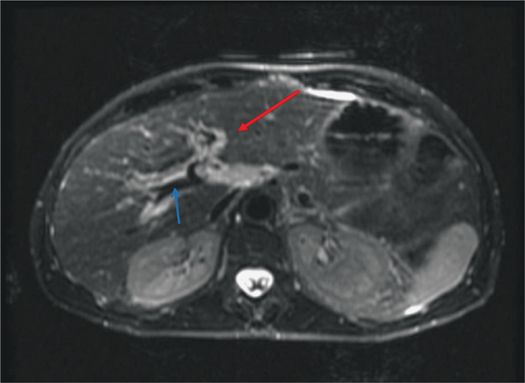
The imaging features of hepatitis are nonspecific. Hepatomegaly with diffuse heterogeneous enhancement of the liver and periportal edema may be the only imaging manifestations (Figure 5–3). Periportal edema is visualized as high signal intensity paralleling along the portal vein on T2 fat-saturation images.9 Imaging findings of a decrease in periportal edema can be indicative of clinical recovery.10 Associated findings include marked gallbladder wall edema without any distension, which helps to differentiate hepatitis from cholecystitis.
Figure 5–3 T2-weighted axial image showing bright periportal edema (red arrow) in a patient with acute hepatitis. The blue arrow indicates the portal vein, which appears black.
Acute Hepatic Vascular Conditions
Hepatic infarcts are typically seen as non-enhancing wedge-shaped areas of low signal on T1 and high signal intensity on T2-weighted images. With infarcts secondary to portal vein thrombosis, there may be a transient increase in enhancement of the affected segment due to a compensatory increase in hepatic arterial flow, which becomes homogeneous on delayed phases.11
Imaging of thrombus is feasible on MRI, which has important clinical implications with respect to prognostication of anticoagulant therapy.12 Acute/subacute thrombus appears hyperintense on T2, with enhancement of the wall of the portal vein probably related to inflammation.
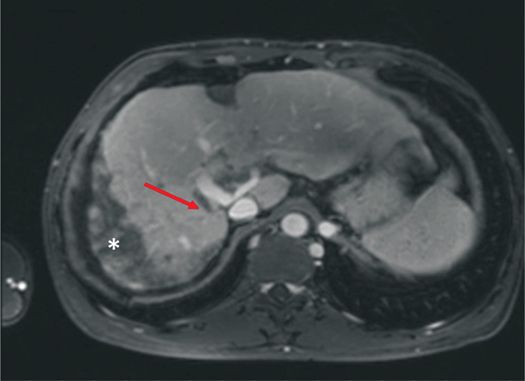
In Budd-Chiari syndrome, associated findings of primary pathology, such as hepatic venous or inferior vena caval narrowing, occlusion, or thrombus, may be seen (Figure 5–4). The secondary features include intrahepatic collaterals, seen as comma-shaped enhancing, intraparenchymal vessels.13 The liver itself may show peripheral areas of heterogeneous high signal on T2 and hypointense signal on T1-weighted images. The caudate lobe is typically spared due to its independent venous drainage.14
Figure 5–4 Post-contrast T1-weighted image showing complete occlusion of the right hepatic vein (arrow) along with perfusion abnormality* in a patient with Budd-Chiari syndrome.
Regenerative nodules may at times pose a diagnostic difficulty on imaging modalities other than MRI. However, on MRI they are easily recognizable: bright on T1-weighted images and enhancing strongly after IV bolus administration of gadolinium contrast. The nodules are predominantly isointense or hypointense relative to the liver on T2-weighted images. This allows for differentiation of these nodules from hepatocellular carcinoma, which is usually hypointense in relation to the liver on T1-weighted images and hyperintense on T2-weighted images.15
Hepatic Hemorrhagic Mass Lesions
Hepatocellular carcinoma and hepatic adenomas are the two most common liver masses that may present with nontraumatic acute hemorrhage.16 Large, peripherally located lesions, devoid of overlying normal hepatic parenchyma, are more likely to rupture and bleed.17 Giant hemangiomas more than 4 cm in size may also bleed. The presence of high signal on T1-weighted image in a T2 heterogeneous mass on MRI is suggestive of hemorrhage.
MRI not only helps in the diagnosis of the bleeding tumor, but also in characterizing the underlying tumor, which in turn can influence treatment. Please refer to the Chapter 17 for further details on characterization of liver masses.
 Gallbladder and Biliary System
Symptomatic Cholelithiasis
Stay updated, free articles. Join our Telegram channel

Full access? Get Clinical Tree


