Left ventricular failure
Right ventricular failure
Inotropes
Vasoconstrictors
Vasodilators
Mechanical assist devices
Intra-cardiac shunts
Originally, an intermittent value for CO was produced using manual thermodilution, requiring a 10 ml bolus of cold fluid to be rapidly injected into a proximal port of the PAC at the end of expiration. The temperature of blood in the pulmonary artery is plotted against time, and the area under the curve is calculated (see Figure 14.1) to produce CO. The addition of a heating element that automatically semi-continuously warms the blood in the pulmonary artery allows more continuous CO monitoring and is the basis of the VigilanceTM system. The mean CO is calculated over several minutes to improve the accuracy, resulting in a delay in the display of any acute changes.
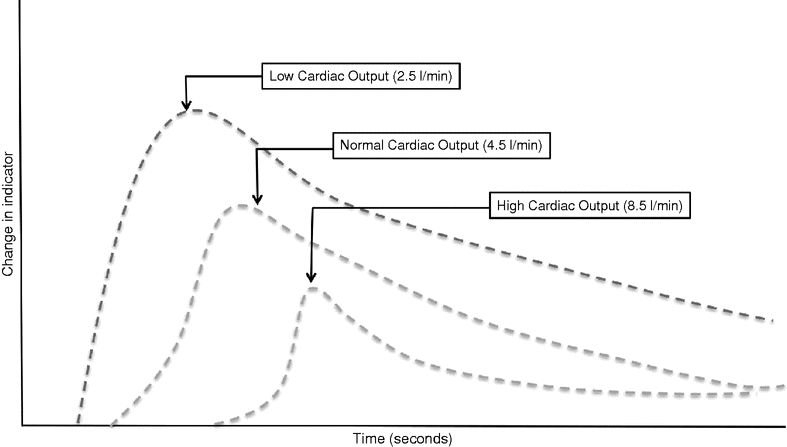
Change in an arbitrary indicator plotted against time in patients with normal and low cardiac output states. A high cardiac output state results in a greater dispersal of indicator resulting in a lower peak concentration and a prolonged wash-out curve. Flow is inversely proportional to the rate of indicator change, and cardiac output is inversely proportional to the area under the curve
Complications
The rate of complications when using the PAC may be inversely related to user experience. Complications related to insertion are observed in 6% of cases. Cardiac arrhythmias also occur frequently (12.5%) but are usually transient (including atrial and ventricular ectopic beats, ventricular tachycardia, and right bundle branch block). Rare complications include catheter malposition or knotting, valve trauma, and pulmonary arterial rupture. Late complications are infrequent if the catheter is removed within 72 hours and include infection, thrombosis, and pulmonary infarction.[21]
Limitations
Reliable results depend on correct catheter position, injection technique, and thermistor accuracy. The presence of intra-cardiac shunts, tricuspid or mitral valve regurgitation, and mitral valve stenosis affects accuracy. High ventilator pressures may also result in falsely high CO readings. The avoidance of complications and the successful interpretation of the PAC data are user-dependent.
Validation
Outcome studies are conflicting. As discussed previously, when the PAC was used to guide therapy in high-risk surgical patients, a mortality and morbidity benefit was found by several investigators.[1,3,4] However, subsequent studies have demonstrated potential harm by using the PAC and increased resource utilization.[5,22,23] Some studies found that despite guiding therapy, no outcome benefit could be demonstrated.[22–24] In addition, the insertion and subsequent interpretation is heavily user-dependent, and experience of the operator is likely to be important. A Cochrane review concluded that PACs did not alter hospital length of stay, mortality, or cost.[21] Importantly, complications occurring as a result of catheter insertion did not result in harm or death.[21,22]
Summary of the PAC
PAC use may still be beneficial in a select group of patients as discussed above and only if the operator and the institution have experience in the insertion, interpretation, and subsequent care of these catheters. In this context it is still an important monitoring tool and provides unique clinical information not easily obtained from other modalities.
Arterial waveform analysis
These devices use an arterial pressure trace to continuously calculate the CO. Compared with the PAC, they are less invasive and require less expertise to insert, maintain, and interpret. Continuous stroke volume (SV) analysis allows the prediction of fluid responsiveness (discussed later), an advantage over intermittent measurements provided by the PAC.
To calculate flow from the pressure trace, the device must calculate the overall vascular impedance, based on the measurement or prediction of vascular resistance and compliance. This may be achieved by using a calibrated technique or by using an uncalibrated technique based on normograph data.
Calibrated devices using pulse-contour analysis or pulse-power analysis
A calibrated device will use an intermittent trans-pulmonary dilution technique. An indicator injected into venous blood will dissipate through cardiac and pulmonary blood volumes before reaching the systemic circulation where it is measured. The change in indicator is plotted against time, and the area under the curve is calculated by the modified Stuart–Hamilton equation as for the PAC. Once calibrated, the device will utilize pulse-contour or pulse-power analysis to provide continuous SV and CO data.
PiCCOTM (Pulsion Medical Systems, Munich, Germany)
The PiCCOTM family of devices (PiCCOplusTM and PiCCOO2TM) use a rapid bolus of cold fluid as the indicator, injected through a central venous catheter. A proprietary thermistor-tipped catheter, which detects the change in temperature, is inserted into the femoral or axillary artery. The proprietary algorithm calculates the aortic impedance and subsequently uses pulse-contour analysis to continuously calculate the SV every 3 seconds. A number of static values of preload such as global end-diastolic volume (GEDV) and intrathoracic blood volume (ITBV) are also produced, discussed later.
The VolumeViewTM set EV1000TM platform (Edwards Life Sciences, Irvine, USA)
The VolumeViewTM using the EV1000TM platform software is calibrated with cold-bolus thermodilution (as above) and uses pulse-contour analysis to measure similar values to the PiCCOTM system. A proprietary thermistor-tipped femoral arterial cannula is also required, and an optional PreSepTM catheter for continuous central venous oxygenation monitoring is available. The unique feature is the software package, which presents the hemodynamic data with a graphical interface facilitating interpretation by the operator.
The LiDCOTM system (LiDCO Ltd, Cambridge, UK)
LiDCOTM uses lithium as the indicator to calculate CO with the trans-pulmonary bolus technique. The peripheral arterial catheter is connected to a proprietary lithium-sensitive electrode which creates a voltage proportional to the lithium concentration in the blood. The algorithm assumes net power change is equal to net flow change and calibration creates a correction factor for vascular compliance. Pulse-power analysis (rather than the pulse-contour) is subsequently used for continuous flow monitoring. This system is less invasive as there is no need for a central arterial catheter or central venous access.
Validation of calibrated devices
The PiCCOTM in particular has been extensively validated in animal studies and in a variety of clinical conditions.[25] The use of GEDV to guide fluid administration in a cardiac ICU reduced duration of vasopressor and inotrope dependency, mechanical ventilation, and length of stay.[26] The EV1000/VolumeViewTM monitor has demonstrated accuracy and reliability equal to that of PiCCOTM, and superior accuracy in measurement of the GEDV.[27]
The LiDCOTM device has also been validated in numerous clinical situations, including in patients with impaired ventricular function after cardiac surgery and undergoing liver transplantation, with a wide variety of COs.[28,29] When used to facilitate GDT in postoperative patients to target a supranormal DO2, a reduced rate of complications and length of hospital stay were demonstrated,[30] and this is used routinely in the author’s institution.
Limitations
All pulse-contour devices, calibrated or not, depend on a good-quality arterial pressure trace. Severe arrhythmias and the use of intra-aortic balloon pump augmentation will result in unreliable data. A proprietary central arterial catheter and central venous access are required to calibrate the device, increasing the invasive nature of the technique. Owing to changes in the vascular resistance, recalibration is required frequently if there is an obvious clinical change.
Summary of calibrated devices
These devices provide accuracy comparable to the PAC with the obvious benefits of being less invasive and less user-dependent, and allowing assessment of dynamic indices. The limitations include reliance of a good-quality arterial pressure trace and the need for recurrent calibrations over time. Each device has been validated for the use in perioperative clinical practice when used in conjunction with evidence-based optimization protocols, and they have found widespread clinical acceptance.
Uncalibrated devices using pulse-contour analysis
Devices without the need for external calibration are a more recent development to meet a need for a user-independent system to display trend data. This allows the assessment of dynamic indices to predict fluid responsiveness and protocol-guided optimization. Most devices use algorithms to calculate flow, which rely on databases containing information from laboratory or comparative studies. One newer system (MostCareTM, Vytech) does not require calibration as it analyzes the arterial waveform to calculate the vascular impedance.
Vigileo/FloTrac SystemTM (Edward Life Sciences, Irvine, USA)
This device requires a proprietary transducer to be connected to a standard arterial catheter. Demographic data (age, height, sex, weight) are manually supplied to calculate the predicted vascular impedance. The arterial trace is sampled at 100 Hz over a 20 second period and compliance and resistance are estimated. The arterial pressure waveform is continually analyzed for changes, and SV, CO, stroke volume variation (SVV), and pulse pressure variation (PPV) are displayed.
PulsioflexTM (Pulsion Medical Systems)
This system uses the same algorithm as the calibrated PiCCOTM devices without in vitro calibration, instead relying on normograph data and biometric information. The basic module will monitor SV, CO, SVV, PPV, and a contractility measurement. For greater accuracy, CO data for calibration can be supplied manually, for example from an esophageal Doppler device. The monitor is expandable and modules can be added that allow bolus thermodilution calibration and continuous SVO2 monitoring.
LiDCOrapidTM (LiDCO Ltd, Cambridge, UK)
This un-calibrated system by LiDCOTM calculates the correction factor for SVR. Using normograph data produced by the manufacturer, aortic blood volume is calculated based on age, height, weight, and body surface area. Newer models also allow the escalation of monitoring with transpulmonary dilution calibration, if required.
MostCareTM System (Vytech, Padua, Italy)
The MostCareTM system is the latest evolution of CO monitor that des not require in vitro or external calibration using a pressure recording analytical method (PRAM) to calculate vascular impedance. The high sample rate of 1,000 Hz is able to identify subtle acceleration or deceleration changes in the arterial waveform produced by retrograde waves originating from the distal vascular tree. These changes are used to calculate the peripheral vascular impedance and therefore produce an extremely reactive system allowing calculation of SV, CO, and vascular resistance.
Validation of uncalibrated devices
A number of studies have been performed comparing the accuracy of the three pulse-contour systems described above.
The accuracy of the Vigileo/FloTracTM device has been questioned despite several incremental updates. The first iteration showed poor agreement with PAC-derived values, and later generations remain unacceptably inaccurate, with published error rates of 40% in non-cardiac patients.[31] Detection of cardiac output changes due to fluid bolus administration and vasopressor therapy [32] was also unreliable. It has, however, been used successfully in protocols for fluid administration in general surgical patients [33] and orthopedic patients.[34]
The uncalibrated LiDCOTM and PiCCOTM devices produce acceptably accurate results when compared to the PAC and are more able to track physiological changes than the FloTracTM in a number of clinical situations.[35] The PiCCOTM device is able to accurately track the changes in the CO during fluid and vasopressors administration,[36] and both these devices have been successfully used to guide intravenous fluid therapy using GDT based on SV optimization and SVV in the perioperative period.
In patients undergoing cardiac interventional procedures and cardiac bypass surgery, PRAM performed well when compared to the PAC [37–39] and echocardiography.[39] In addition, it appears to be accurate in patients with low CO states, receiving inotropes or intra-aortic balloon pump augmentation. Although promising studies exist, larger validation studies are still required.
Summary of uncalibrated devices
These devices are useful for the perioperative patient as they are minimally invasive, do not require calibration and are not user-dependent. The use of these devices in conjunction with evidence-based GDT protocols has been shown to reduce complications following surgery. However, convenience is traded for accuracy, and it is likely that in a hemodynamically compromised patient, an alternative monitoring device may be more appropriate.
How to use these monitors to predict fluid responsiveness
The aim of perioperative care is to avoid the accumulation of oxygen debt by maintaining adequate oxygen delivery to the tissues. The first step is to identify patients who are not able to do this by themselves, by instigating the appropriate physiological monitoring. If augmentation is required, the clinician must determine whether this can be achieved with intravenous fluid therapy. Thus we need to predict which patients are likely to be fluid- or preload-responsive.
Static markers of preload status
Static markers of cardiac preload status include the central venous pressure (CVP), pulmonary artery occlusion pressure, ventricular end-diastolic volumes, GEDV, ITBV, and extravascular lung water (EVLW).
GEDV and ITBV are two static markers of preload provided by pulse-contour analysis devices (PiCCOTM and VolumeViewTM). They have been incorporated successfully into a number of optimization protocols as discussed earlier and are superior to the CVP at identifying the fluid-responsive patient.[40] EVLW reflects the amount of pulmonary interstitial fluid. It does not correlate well with oxygenation or chest radiograph lung opacification but does reflect severity of illness and length of ventilation. Reducing the ITBV to normal levels may reduce the EVLW.
These values do not reliably predict the fluid-responsive state and are unable to identify which patients will benefit from fluid therapy. This is because the relationship between cardiac reserve, vascular reserve, and contractility is too complex to be adequately represented by one cardiac measurement.[40]
Related posts:


Stay updated, free articles. Join our Telegram channel

Full access? Get Clinical Tree


