KEY POINTS
Randomized trials have found that use of a pulmonary artery catheter did not influence the mortality of critically ill patients with shock or acute respiratory distress syndrome.
Although measurement of right atrial (central venous) pressure (Pra) is a central component of early goal-directed therapy for septic shock, use of the Pra to guide hemodynamic management is controversial.
Partial wedging can lead to marked overestimation of the pulmonary artery wedge pressure (Ppw) and should be suspected when the measured Ppw exceeds the pulmonary artery diastolic pressure (Ppad). With pulmonary hypertension, partial wedging may be present despite a positive Ppad-Ppw gradient and should be suspected when the latter markedly narrows in comparison with previous values.
Positive end-expiratory pressure (PEEP) and active expiration cause the measured Ppw and Pra to overestimate transmural pressure, with active expiration resulting in greater errors. Simultaneous recording of bladder pressure and Pra (or Ppw) can be helpful for assessing the impact of active expiration on transmural pressure.
Hemodynamic waveforms may be helpful in the diagnosis of certain cardiac disorders: Large v waves in the Ppw tracing are seen in acute mitral regurgitation, but can also occur with hypervolemia. Cardiac tamponade is characterized by equalization of the Ppw and right atrial pressure (Pra) with blunting of the y descent. Tricuspid regurgitation often produces a broad c–v wave and a prominent y descent. Inspection of the Pra during narrow complex tachycardias may be helpful if flutter waves or regular cannon a waves (supraventricular reentrant tachycardia) are seen.
Neither the Pra nor the Ppw are reliable predictors of fluid responsiveness. However, failure of the Pra to fall with spontaneous inspiration indicates that the patient is unlikely to benefit from a fluid challenge.
For several decades, decisions regarding therapy with fluids and vasoactive drugs in the ICU have relied on intravascular pressures obtained with either a central venous catheter (CVC) or pulmonary artery catheter (PAC). Despite this widespread use, the value of invasive hemodynamic monitoring is controversial.1-4 Randomized studies of the PAC in a variety of clinical settings have found neither a positive nor negative impact on mortality.5-11 To some, these results provide compelling evidence against continued use of the PAC.1,2 Others have argued that they establish the safety of the PAC, and that an impact on mortality is an unreasonable benchmark for any bedside monitoring device.12,13 Use of the CVC for hemodynamic monitoring is also controversial. While guidelines for management of patients with septic shock recommend measurement of the central venous pressure (CVP) as a component of early goal-directed therapy,14 some have argued that use of the CVP to guide fluid therapy should be abandoned.3
The increased availability of less invasive tools for bedside hemodynamic assessment, including point-of-care echocardiography and minimally invasive measurement of cardiac output, has clearly reduced the need for invasive monitoring.15,16 Nonetheless, we believe that invasive hemodynamic monitoring can still be useful in managing selected critically ill patients, especially when noninvasive assessment or empirical therapeutic trials have proven unsuccessful.17 Implicit in this view is that clinicians should have an in-depth understanding of those aspects of cardiorespiratory physiology that form the underpinnings of hemodynamic monitoring, and must also be knowledgeable about technical aspects of invasive monitoring, including common pitfalls. Errors in data acquisition and interpretation likely pose a greater risk to patients than catheterization per se.18,19
This chapter will focus on use of pressure waveforms obtained from the PAC and CVC in the management of critically ill patients. Areas of emphasis will include (1) fundamental principles of hemodynamic data acquisition, including common mistakes in interpretation of intravascular pressures, (2) analysis of hemodynamic waveforms in normal individuals and in various cardiovascular disorders, (3) impact of changes in intrathoracic pressure on interpretation of cardiac filling pressures, and (4) assessment of the adequacy of preload and prediction of fluid responsiveness.
PRESSURE MONITORING SYSTEM
Essential system components required for pressure monitoring include a fluid-filled catheter and connecting tubing, a transducer that converts mechanical energy from the fluid-filled tubing into an electrical signal, and a signal-processing unit that conditions and amplifies this electrical signal for display. Two primary features of the pressure monitoring system determine its dynamic response properties: natural resonant frequency and damping coefficient.20-22 Once perturbed, each catheter-transducer system tends to oscillate at a unique (natural resonant) frequency determined by the elasticity and capacitance of its deformable elements. An undamped system responds well to the low-frequency components of a complex waveform, but it exaggerates the amplitude of components near the resonant value. Modest damping is desirable for optimal fidelity and for suppression of unwanted high-frequency vibration (noise); however, excessive damping smoothens the tracing unnaturally and eliminates important frequency components of the pressure waveform.
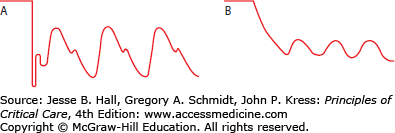
Overdamping due to air bubbles, clots, fibrin, or kinks diminish transmission of the pulsatile pressure waveform to the transducer, resulting in a decrease in systolic pressure and an increase in diastolic pressure. A simple bedside test for overdamping is the “rapid flush” test.20 Because of the length and small gauge of the catheter, very high pressures are generated near the transducer when the flush device is opened. With sudden closure of the flush device, an appropriately damped system will show a rapid fall in pressure with an overshoot followed by a prompt return to a crisp pressure tracing, giving a “square wave” appearance. In contrast, an overdamped system has a gradual return to the baseline pressure without an overshoot (Fig. 28-1). Although less common, an underdamped system can lead to significant systolic overshoot with overestimation of systolic pressure. To give optimal performance, the system should (1) be free of bubbles, kinks, and clots, (2) avoid excessive tubing length (<48 in), and (3) have the minimal possible number of stopcocks. Simple visual inspection of the response to the rapid flush test is most often used to determine if the pressure monitoring system is acceptable. However, a paper strip recording of the rapid flush test can be used to make a more precise assessment of the dynamic response characteristics.22
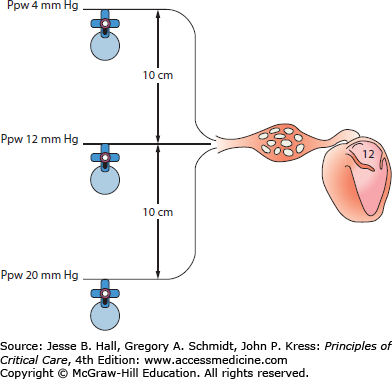
For the hydraulic monitoring system to display accurate pressures, it is essential that the system is first zeroed with the transducer exposed to atmospheric pressure. The air-fluid interface of the monitoring system (ie, the stopcock attached to the transducer) is then placed at the phlebostatic axis (the midpoint between the most anterior and posterior aspects of the chest in the fourth intercostal space) with the patient supine. Alternatively, the transducer can be placed 5 cm below the sternal notch with the aid of a carpenter’s level.23 Movement of the transducer relative to the heart will cause the recorded pressure to underestimate or overestimate the true value (Fig. 28-2).
PRESSURE WAVEFORMS
The CVC permits measurement of a single intravascular pressure (CVP) that is recorded after catheter insertion. In contrast, the properly placed PAC provides pressure data from three sites and insertion is guided by transitions in the pressure waveform as the inflated catheter is advanced. Before discussing characteristics of normal and pathologic hemodynamic waveforms, waveform-guided insertion of the PAC will be briefly addressed.
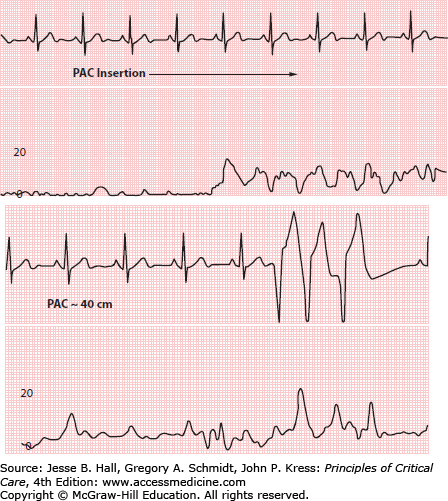
The PAC has two lumens for pressure recording: a distal lumen and a proximal lumen that opens 30 cm from the catheter tip. A single pressure transducer is connected to the distal port, and the proximal port is connected to a separate infusion of intravenous fluid (Fig. 28-3). Use of a “bridge” and stopcocks permits right atrial pressure (Pra) to be recorded from the proximal lumen after catheter insertion. Stopcocks should be checked before insertion to be sure that the monitor displays pressure from the distal lumen. Inadvertent recording from the proximal lumen should be suspected if during insertion the displayed pressure is initially near zero and then suddenly increases as the proximal lumen enters the introducer, or if there is ventricular ectopy while the monitor displays a Pra waveform, indicating that the catheter tip is in the right ventricle (RV) (Fig. 28-4).
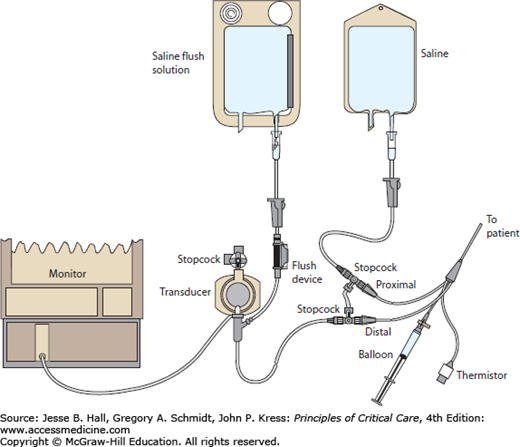
FIGURE 28-4
Proximal lumen inadvertently open to pressure transducer during insertion of pulmonary artery catheter (PAC). Top, pressure suddenly increases as the proximal port enters introducer. Bottom, ventricular ectopy (catheter tip in right ventricle) while the monitor displays a right atrial waveform. Scale in millimeters of mercury.
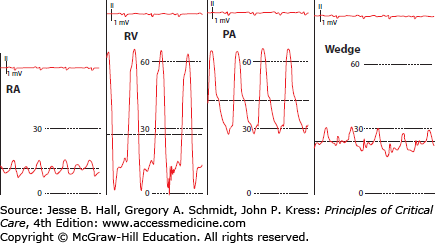
Once the catheter tip has passed through the introducer (15-20 cm), the balloon is inflated and the PAC is advanced into the RV (Fig. 28-5). After entering the RV, insertion of an additional 10 to 15 cm of catheter is usually sufficient to reach the pulmonary artery. Feeding excessive catheter while the tip remains in the RV can lead to coiling and possible knotting. The pulmonary artery pressure tracing (Ppa) is evidenced by an abrupt rise in diastolic pressure (Fig. 28-5). With further advancement, a fall in mean pressure and transition to an atrial waveform (see below) signals transition to a pulmonary artery occlusion (wedge) pressure (Ppw) (Fig. 28-5).
FIGURE 28-5
Waveform transition as catheter is advanced from the right atrium (RA) to the wedge position. Note the increase in diastolic pressure as the catheter passes from the right ventricle (RV) to the pulmonary artery (PA). Dashed horizontal lines represent mean pressure. Scale in millimeters of mercury.
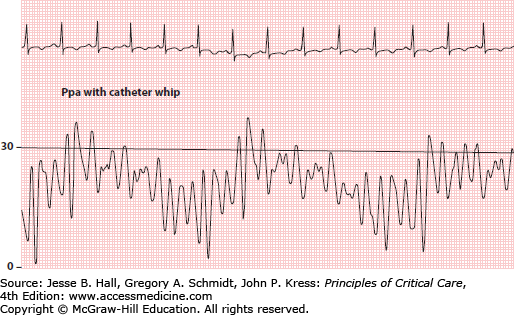
Several factors can hinder analysis of pressure waveforms during PAC insertion. Large swings in intrathoracic pressure due to vigorous respiratory effort may create difficulty with waveform interpretation.24 If the patient is mechanically ventilated, sedation (or even temporary paralysis) to reduce respiratory excursions may aid interpretation and will enhance reliability of the measurements obtained.25,26 Another problem is excessive catheter “whip” caused by “shock transients” being transmitted to the catheter during RV contraction in hyperdynamic states (Fig. 28-6). Finally, an overdamped system (see above) may make it more difficult to discern transitions in pressure waveforms.
Right atrial pressure (Pra) is measured from either the distal lumen of the CVC or the proximal port of the PAC. (The CVP and Pra are equivalent and the latter designation will be used in the remainder of this chapter). The Pra is most often used to assess intravascular volume status, but characteristics of the Pra waveform can also aid in the diagnosis of certain cardiac (and pericardial) disorders, including arrhythmias. For both purposes, it is important to appreciate the characteristics of the normal Pra waveform.
In sinus rhythm, the Pra waveform is characterized by two major positive deflections (a and v waves) and two negative deflections (x and y descents) (Fig. 28-7). A third positive wave, the c wave, is occasionally seen. The a (atrial) wave is due to atrial systolic contraction. The a wave is followed by the x descent as the atria undergo postsystolic relaxation and the atrioventricular junction moves downward during early ventricular systole. When visible, a c wave due to closure of the atrioventricular valves interrupts the x descent. When a c wave is seen, standard nomenclature dictates that the initial descent is termed x and the second descent is termed x’ (Fig. 28-7). After the x descent, the v (ventricular) wave is generated by passive filling of the atria during ventricular systole. The y descent results from a fall in atrial pressure as the tricuspid valve opens with the onset of diastole (Fig. 28-7).
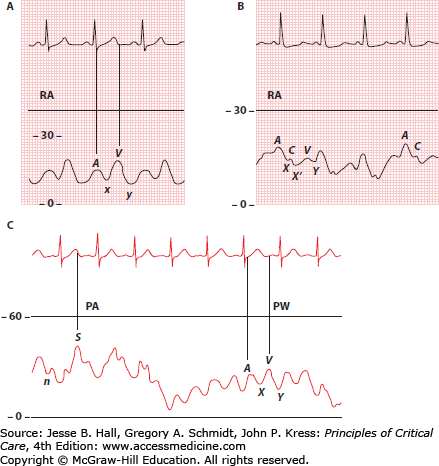
In order to evaluate pressure waveforms adequately, it is essential to use a dual channel recorder that allows simultaneous recording of cardiac electrical activity and pressure. An electrocardiographic (ECG) lead that clearly demonstrates atrial electrical activity should be chosen. Analysis of the atrial pressure tracing begins with identification of the P wave in the ECG. The first positive-pressure wave to follow the P wave is the a wave. The right atrial a wave usually is seen at the beginning of the QRS complex, provided that atrioventricular conduction is normal (Fig. 28-7). When visible, the c wave follows the a wave by an interval equal to the electrocardiographic PR interval (Fig. 28-7). The peak of the right atrial v wave normally occurs simultaneously with the T wave of the electrocardiogram, provided that the QT interval is normal (Fig. 28-7).
The Pra is often used as an estimate of RVEDP. Prominent a or v waves will cause the mean Pra to overestimate RVEDP.27 A more frequent problem is underestimation of RVEDP when there is a large x or y descent. A large y descent often accompanies tricuspid regurgitation, and a prominent y descent (and often x descent) is also common with pericardial constriction, right heart failure, and restrictive physiology caused by diastolic dysfunction or marked hypervolemia (Figs. 28-8 and 28-9). To avoid errors, it is best to measure Pra at the base of a wave just before the onset of ventricular systole rather than as a mean value (Fig. 28-8).27,28
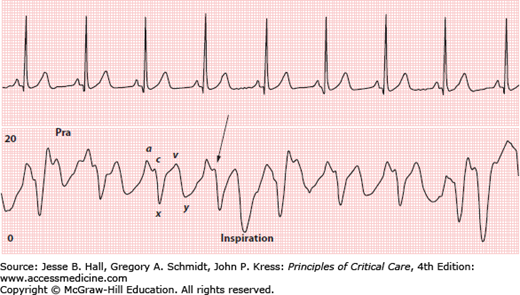
FIGURE 28-9
Acute pulmonary hypertension with right ventricular failure. Right atrial pressure (Pra) is much higher than pulmonary artery wedge pressure (Ppw). Note the prominent y descent in the Pra tracing. Even though pulmonary vascular resistance is markedly elevated, there is only a moderate increase in pulmonary artery pressure (Ppa) because of decreased cardiac output (CO). Scale in millimeters of mercury.
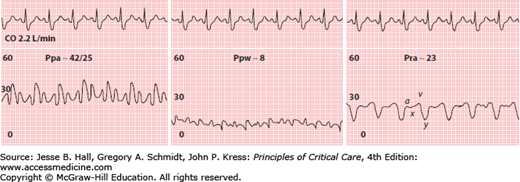
Normal Pra is approximately 2 to 8 mm Hg.29 In the absence of left ventricular (LV) dysfunction, the Pra is typically 2 to 5 mm Hg lower than the Ppw.30 The Ppw may be markedly higher than the Pra in patients who have either systolic or diastolic LV dysfunction.31 Conversely, the Pra may exceed the Ppw in patients with RV failure due to increased pulmonary vascular resistance (PVR) or RV infarction (Fig. 28-9).
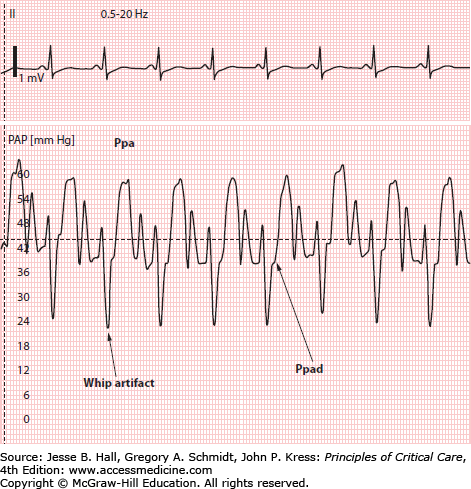
The pulmonary artery waveform has a systolic pressure wave and a diastolic trough (Fig. 28-7). A dicrotic notch due to closure of the pulmonic valve is occasionally seen on the terminal portion of the systolic pressure wave. Like the right atrial v wave, the pulmonary artery systolic wave typically coincides with the T wave of the ECG (see Fig. 28-7). The pulmonary artery diastolic pressure (Ppad) is recorded as the pressure just before the beginning of the systolic pressure wave. Catheter whip artifacts can lead to significant underestimation of the Ppad (Fig. 28-10).
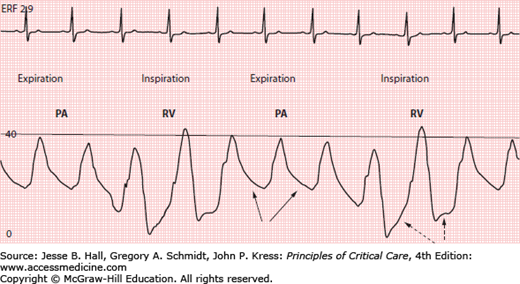
The tip of the PAC is optimally positioned proximally in the main or lobar pulmonary arteries since distal placement may increase risk of pulmonary artery rupture with balloon inflation.32 However, if the tip of the PAC is too proximal and lies just beyond the pulmonic valve, the catheter tip can fall back into the RV with small changes in patient position, or even with tidal ventilation (Fig. 28-11). This must be recognized and the catheter repositioned since a catheter tip in the RV may predispose to ventricular arrhythmias. Recognition that the tip has migrated back into the RV is facilitated by awareness of two principal differences between a Ppa and RV waveform: (1) the RV has a lower diastolic pressure than the Ppa, and (2) while Ppa progressively falls during diastole, diastolic filling will produce a gradual rise in RV pressure (Fig. 28-11).
Ppa is determined by the volume of blood ejected into the pulmonary artery during systole, PVR, and downstream left atrial pressure (Pla). Normal values for Ppa are as follows: systolic, 15 to 30 mm Hg; diastolic, 4 to 12 mm Hg; and mean, 9 to 18 mm Hg.29 The normal pulmonary vascular network is a low-resistance circuit with enormous reserve, so large increases in cardiac output do not cause pressure to rise significantly. This large capillary reserve normally offers such slight resistance to run off during diastole that the difference between the Ppad and the Ppw (the Ppad-Ppw gradient) is 5 mm Hg or less. When the Ppad-Ppw gradient is minimal, the Ppad can be used as a surrogate for the Ppw, obviating need for repeated balloon inflation.
The Ppad-Ppw gradient may be used to differentiate pulmonary hypertension due to increased PVR from pulmonary venous hypertension. Increased PVR causes the Ppad-Ppw gradient to widen, while an increase in left atrial pressure produces a proportional rise in the Ppad and Ppw.33,34 Pulmonary hypertension due to an increase in PVR occurs in many conditions encountered in the ICU, including pulmonary embolism, ARDS, and COPD among others. When PVR is increased, the degree of pulmonary hypertension will also be influenced by the cardiac output. For example, patients with high cardiac output due to sepsis or liver disease may have significant pulmonary hypertension despite only a mild-moderate increase in PVR. Conversely, Ppa may be only modestly increased when increased PVR is accompanied by a low cardiac output, as can occur with acute massive pulmonary embolism (Fig. 28-9).
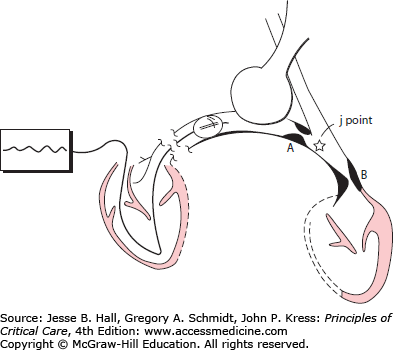
The pulmonary artery wedge pressure (Ppw) is obtained when the inflated catheter obstructs forward flow within a branch of the pulmonary artery, creating a static column of blood between the tip of the catheter and the point (junction, or j point) in the pulmonary venous bed where it intersects with flowing blood20 (Fig. 28-12). Since the fully inflated catheter obstructs a segmental or lobar pulmonary artery, the j point is usually located in medium to large pulmonary veins. Owing to resistance in the small pulmonary veins, the Ppw will underestimate the pressure in the pulmonary capillaries (see below), but the absence of any appreciable resistive pressure drop across the larger pulmonary veins dictates that the Ppw will reliably reflect Pla (Fig. 28-12).
FIGURE 28-12
Principle of the wedge pressure (Ppw) measurement. When the inflated balloon obstructs arterial inflow, the catheter will record the pressure at the junction of the static and flowing venous channels, the j point. An obstruction distal (B) to the j point will cause the Ppw to overestimate left atrial pressure (Pla). With obstruction proximal (A) to the j point (eg, venoocclusive disease), the Ppw accurately reflects Pla but greatly underestimates pulmonary capillary pressure. (Reproduced with permission from O’Quinn R, Marini JJ. Pulmonary artery occlusion pressure: clinical physiology, measurement and interpretation. Am Rev Respir Dis. August 1983;128(2):319-326.)
The Ppw tracing contains the same sequence of waves and descents as the Pra tracing. However, when referenced to the ECG, the waves and descents of the Ppw will be seen later than those of the Pra, because the pressure waves from the left atrium must travel back through the pulmonary vasculature and a longer length of catheter. Therefore, in the Ppw tracing, the a wave usually appears after the QRS complex, and the v wave is seen after the T wave (see Fig. 28-7). When referenced to the ECG, the v wave of the Ppw tracing occurs later than the Ppa systolic pressure wave. An appreciation of the latter concept is critical when tracings are being analyzed to ensure that balloon inflation has resulted in an acceptable transition from Ppa to Ppw and to detect the presence of a “giant” v wave in the Ppw tracing (see below).
For the Ppw to accurately represent Pla, it is essential that the tip of the inflated catheter lie free within the vessel lumen. Obstruction to flow at the catheter tip can lead to overwedging. Overwedging is recognized by a progressive rise in pressure during balloon inflation and usually results from the balloon trapping the tip against the vessel wall. In such cases, the continuous flow from the flush system results in a steady buildup of pressure at the catheter tip, or at least as high as required to cause compensatory leakage from the trapped pocket (Fig. 28-13). If overwedging occurs, the catheter should be deflated and retracted before reinflating the balloon.
FIGURE 28-13
Overwedging. Arrow indicates time of balloon inflation. Scale in millimeters of mercury. (Reproduced with permission from Sharkey SW. A Guide to the Interpretation of Hemodynamic Data in the Coronary Care Unit.
Related posts:


Stay updated, free articles. Join our Telegram channel

Full access? Get Clinical Tree


