Figure 7.1 Anatomy. (a) Relationship of the IVC to the aorta within the abdomen. Note the proximal IVC and aorta course behind the liver. Artwork created by Emily Evans © Cambridge University Press. (b) The relationship between the IVC and the aorta and its branches. Illustration by Laura Berg, MD.
Technique
Point-of-care questions
Transducer selection and orientation
Depending on the size of the child, different transducer types can be used. Low-frequency (2–5 MHz), curvilinear abdominal transducers are the best for scanning most pediatric abdomens, as they give the highest resolution pictures. It is possible, however, to use phased-array transducers, and, in very small, thin children, linear transducers can also identify the relevant structures.
The transverse view can be obtained by placing the transducer just caudal to the xiphoid process, with the indicator oriented towards the patient’s right side (Figure 7.2a). The transducer is oriented perpendicular to the patient’s body in order to adequately achieve an accurate cross-section of the IVC. The depth should be deep enough to see the vertebral body shadow. Anterior to the vertebral shadow lie two vascular structures. The IVC is on the patient’s right and aorta to the patient’s left. The longitudinal view is obtained by rotating the transducer 90 ° clockwise, with the indicator towards the patient’s head (Figure 7.3a). Sliding from side to side, you can move from IVC to aorta. In order to follow the IVC along its long-axis to where it enters into the right atrium, the transducer needs to be angled slightly towards the patient’s right (Figure 7.3b).

Figure 7.2 IVC imaging, transverse view. (a) Transducer placement, with the indicator oriented towards the patient’s right side. (b) Ultrasound image of the transverse view of the aorta and IVC. (c) Illustration indicating important structures visualized on the ultrasound image, with the vertebral body shadow, Aorta, and IVC. Illustration by Laura Berg, MD.
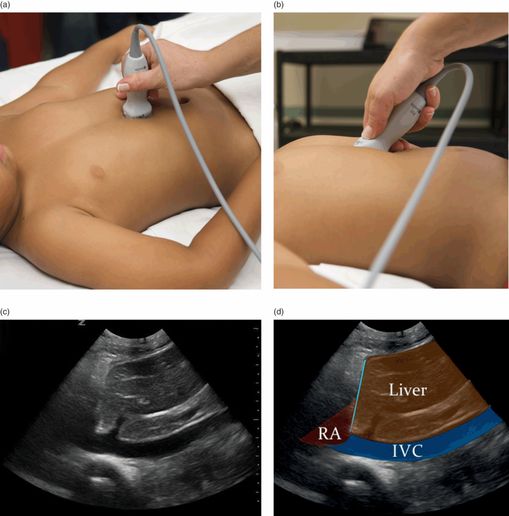
Figure 7.3 IVC imaging, longitudinal view. (a) Transducer placement, with the indicator oriented towards the patient’s head. (b). In order to visualize the IVC along its entire length, as it enters the right atrium (RA), it is often necessary to angle the wrist and direct the transducer towards the patient’s right side. (c) Ultrasound image of the longitudinal view of the aorta. (d) Illustration indicating important structures visualized on the ultrasound image, including the right atrium (RA), liver, and IVC. Illustration by Laura Berg, MD.
The transverse and longitudinal views of the aorta are obtained with the same transducer orientation as the views of the IVC. It is important to maintain proper transducer orientation, with the indicator towards the patient’s right, in order to appropriately identify the IVC and aorta. In order to thoroughly evaluate the aorta, it should be visualized and measured at the proximal, mid, and distal aorta in addition to the branching of the aorta into the iliac arteries. The scan is generally performed from the xiphoid region down to the umbilicus (Figure 7.4a). Depending on the level of interest you can trace the IVC and aorta caudally by sliding the transducer towards the umbilicus, while maintaining the same orientation. The aorta should also be visualized in its long-axis, or longitudinal view (Figure 7.5a).
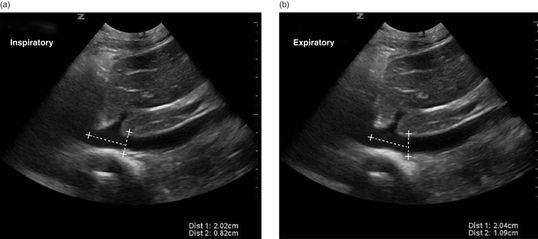
Figure 7.4 IVC respiratory variation, the caval index. (a) In the longitudinal view of the IVC, a measurement can be made of the diameter of the IVC during inspiration 2 cm away from the diaphragm. (b) The longitudinal IVC measurement can be made during expiration. These measurements can be used to calculate the caval index: (1.09 − 0.82) / 1.09 = 0.25 (25%).

Figure 7.5 M-mode image of IVC. In the longitudinal view of the IVC, measurements can be performed in M-mode during (a) inspiration and (b) expiration.
Patient position and preparation
The patient should be in a supine position. There is no special preparation for this study. Gentle pressure may be applied to the transducer in order to displace bowel gas, which may obstruct the view of the IVC and aorta.
Ultrasound imaging: IVC
The three most common views for visualizing the IVC include: the subxiphoid transverse view, the subiphoid longitudinal view, and the anterior midaxillary line longitudinal view. A recent study by Saul et al. showed that the location which had the highest inter-rater reliability was the anterior midaxillary line longitudinal view, using the liver as an acoustic window. In the transverse view, the IVC lies to the patient’s right and the aorta to the patient’s left. This corresponds to the left- and right-hand side of the screen, respectively (Figure 7.2b). The IVC and aorta lie anterior to the vertebral body, which exhibits posterior shadowing. The IVC should also be visualized in its long-axis, as it courses through the liver and enters into the right atrium (Figure 7.3c,d).
Sonographically, the IVC may be distinguished from the aorta, since it has thinner walls, does not exhibit pulsations, is compressible, exhibits respiratory variation, and courses through the diaphragm in its longitudinal view. It is important to note, however, that the IVC and aorta run close together, and in smaller children aortic pulsations may be transmitted to the IVC, giving the appearance that the IVC has pulsations. In contrast, the aorta has thick echogenic walls, is pulsatile, exhibits high-flow velocity, is not compressible, and does not exhibit respiratory variation.
IVC/Ao ratio (transverse view)
Obtaining the caval index may be technically difficult and of limited accuracy in young children. It has been hypothesized that there may be a growth curve of the IVC, since presumably the IVC and aorta both grow with age and size or body mass index (BMI). Recent data, that have yet to be validated, suggest that there may be a linear relationship between IVC size and the patient’s age in months. Several other studies use the IVC/aorta ratio for this evaluation. This is because the abdominal aorta diameter remains constant despite intravascular volume depletion, and the aorta corrects for size and age of the patient; the IVC/aorta ratio has been suggested to be a more convenient and accurate measurement in the pediatric population. This is a ratio between the AP diameter of the IVC and the AP diameter of the aorta, both being measured in a single still image of the transverse view at the level of the left renal vein. The IVC/Ao ratio is less than 1 in dehydrated children and improves to ≥1 after fluid challenge (Figure 7.4b).
Caval Index (longitudinal view)
The IVC exhibits changes in its size during respiration, due to changes in intrathoracic pressure. During expiration, the IVC expands, while during inspiration it contracts. The caval index may be calculated based on the measurements of the IVC in the longitudinal view (Figure 7.4a,b). Of note, all measurements of the IVC are the AP diameter. A caval index ≥ 50% is strongly associated with a low CVP.

Related posts:


Stay updated, free articles. Join our Telegram channel

Full access? Get Clinical Tree


