TOPICS
1. Hemodynamic calculations and invasive monitors: why are they important and how to determine them?
2. The pumping heart: how does the pump contract and relax?
3. Pharmacology and hemodynamics: an introduction
4. TEE and hemodynamic instability: how TEE advances the diagnosis of hypotension?
Understanding hemodynamic principles helps us determine the mechanisms underlying hemodynamic instability and guides our treatment. Fortunately, the same basic physiologic principles apply in both the healthy patient undergoing laparoscopic cholecystectomy as well as in the patient with low ejection fraction undergoing multiple valve replacements. Unfortunately, the valve replacement patient is more likely to decompensate severely when faced with the hemodynamic roller coaster associated with general anesthesia induction (Figure 2–1).
HEMODYNAMIC CALCULATIONS AND INVASIVE MONITORS: WHY ARE THEY IMPORTANT AND HOW TO DETERMINE THEM?
Irrespective of the nature of the anesthetic that we plan to deliver, one of the main considerations is the expected impact upon the patient’s blood pressure and cardiac output. Simply, whether we are performing an interscalene block, a neuraxial technique, or a general anesthetic we know that we have the ability to seriously affect both the patient’s blood pressure and their heart’s pumping ability. Generally, we expect that when we deliver a large induction dose of propofol or a high-inspired concentration of an inhalational anesthetic the blood pressure will decrease.
Of course, in otherwise healthy patients undergoing noncardiac surgery, periods of hypotension are frequently attributed to “anesthetic effects” and are routinely treated by volume administration, ephedrine or phenylephrine, and surgical stimulation. Hemodynamic calculations are rarely obtained as these events are fleeting and the underlying mechanism anticipated. Hemodynamic calculations aid clinicians in the diagnosis of hypotension and help guide treatment options when routine responses to hypotension, which are otherwise successfully employed in healthy patients, might be injudicious or harmful to the cardiac patient.
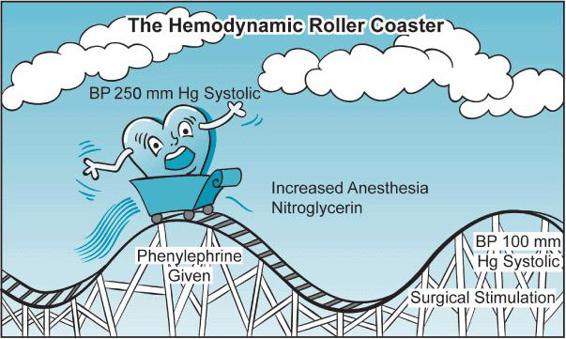
Figure 2–1. Anesthesia manipulations can often stress the heart and the patient. While many healthy patients can tolerate these swings in blood pressure, the cardiac surgery patient may be unable to do so without developing myocardial ischemia and ventricular dysfunction. (From: Wasnick JD. Handbook of Cardiac Anesthesia and Perioperative Care. Boston, MA: Butterworth Heinemann; 1998, with permission.)
Blood Pressure
Although the absolute definition of hypotension is somewhat clouded in the literature,1 a patient is considered hypotensive when the systolic blood pressure is reduced by 20% or more from the patient’s baseline blood pressure. Different authors set different cutoffs as to what constitutes a hypotensive patient. While in the past systolic pressure of less than 90 mm Hg was thought hypotensive, this value has recently been suggested as being too low. For example, the new cutoff value for hypotension has been reset to 110 mm Hg systolic in trauma patients.2
Each practitioner must determine, however, for each individual patient what constitutes systemic pressures that would warrant treatment. In the adult cardiac surgery patient it is likely that any patient with a systolic blood pressure less than 80 mm Hg would be considered in need of some intervention. This chapter will examine how to approach the hypotensive cardiac patient and to apply appropriate therapy. Some of the causes of perioperative hypotension are presented in Table 2–1.
Table 2–1. Differential Diagnosis of Perioperative Hypotension
Hypovolemia Myocardial ischemia and infarction Systolic and diastolic ventricular failure Pneumothorax Pericardial tamponade Arrhythmias Dynamic left ventricular outflow obstruction Pulmonary embolism Right ventricular failure Reduced sympathetic tone Anaphylaxis Sepsis |
An understanding of hemodynamics can help discern the numerous possible etiologies responsible for a patient’s hypotension. As a first step we need to understand how the blood pressure is generated. Blood pressure (BP) gradients drive the delivery of blood throughout the circulation. BP is similar to Ohm’s law that regulates the flow of current through a circuit:
V = I × R
where:
V = potential
I = current intensity (electron flow)
R = resistance (electrical)
The potential (V) in the circuit drives the current (I) through the resistance (R). The lower the resistance the greater the current flow.
The basic formula for blood pressure is quite similar:
BP = CO × SVR
where:
BP = blood pressure
CO = cardiac output (blood flow)
SVR = systemic vascular resistance
Thus, blood pressure has only two fundamental determinants: cardiac output and systemic vascular resistance. Consequently, when patients become hypotensive they can do so only because of reductions in cardiac output, systemic vascular resistance, or both.
Indeed, all of the disease states listed in Table 2–1 reduce blood pressure by having an impact on the patient’s cardiac output or systemic resistance.
Cardiac Output
Cardiac Output (CO) is the product of the stroke volume (SV) and the heart rate (HR). The normal cardiac output of 4 to 6 L/min must be interpreted in relation to a patient’s body surface area. An elderly, small woman with a small body surface area (BSA) will require less cardiac output to meet her metabolic needs than will a larger individual. The cardiac index (CI) {CO/BSA} ranges from 2.2 to 4.2 L/min/m2. Ultimately when considering CO and CI, practitioners are really interested in making sure that an adequate amount of blood is being delivered to the tissues to maintain tissue viability. In general a CI less than 2.2 L/min/m2 is concerning as it may lead to anaerobic metabolism and metabolic acidosis. However, there are many factors that determine if a particular CI is adequate for an individual patient’s metabolic needs. These include patient temperature, hemoglobin concentration, and oxygen saturation.
Stroke Volume (SV)
The SV reflects the output of the heart during an individual beat.
CO = SV × HR
SV = CO/HR
Normal values = 50 to 100 mL/beat
There are a number of determinants that affect the SV. These include:
1. Volume: Patients must have an adequate preload in order to generate a normal SV. Hypovolemia due to various causes is one of the most obvious causes of reduced SV. Hypovolemic patients are often hypotensive and tachycardic with a reduced SV. SV can also be reduced in situations of reduced venous return to the heart such as institution of positive pressure ventilation, pericardial tamponade, or pneumothorax.
2. Afterload: Recall, BP = CO × SVR. The SVR and the SV are inversely related; as the resistance against which the heart pump increases, the SV will decrease, whereas when the SVR is reduced, the SV increases. Conditions, which reduce SVR, include those that produce vasodilatory states (eg, sepsis, spinal shock, etc). Conditions, which increase SVR, are numerous but in general center upon an increase in sympathetic outflow (eg, hypertension, heart failure).
3. Myocardial contractility: Myocardial ischemia, myocardial infarction, valvular heart diseases, and cardiomyopathies can all affect the ability of the heart both to relax and to contract. Impaired contractility can lead to a reduction in stroke volume.
As mentioned SV represents the amount of blood ejected from the heart during a beat.
So, SV = left ventricular end-diastolic volume – left ventricular end-systolic volume.
The stroke volume can be depicted graphically through the pressure-volume loop (Figure 2–2).
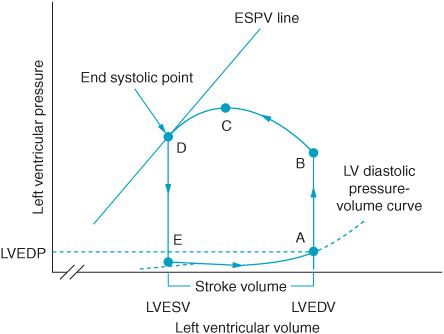
Figure 2–2. The pressure-volume loop depicts graphically the hemodynamic changes in the left ventricle during a heartbeat and the ejection of one stroke volume (SV). Segment A-B occurs at the beginning of systole after the mitral valve closes. (A) The left ventricular end-diastolic pressure is noted on the graph at the end of diastolic filling. Pressure in the ventricle gradually builds until point B is reached when the aortic valve opens (B) and blood is ejected from the ventricle. The aortic valve closes when ejection is complete at end systole. The line at point D identifies end systole. Moving the slope of this line to the reader’s right represents a shift to a less contractile state. Moving the slope to the left reflects a more highly contractile ventricle. Segment D-E represents isovolumetric relaxation. Once pressure in the ventricle is reduced the mitral valve again opens (point E) and diastolic filling resumes in preparation for the heart’s next systole. Left ventricular end-diastolic pressure (LVEDP), left ventricular end-diastolic volume (LVEDV), end-systolic pressure-volume (ESPV) (From: William J Hoffman, John D Wasnick, eds. Postoperative Critical Care of the Massachusetts General Hospital. 2nd ed. Boston, MA: Wolters Kluwer; 1992, with permission.)
Systemic Vascular Resistance
SVR is estimated as follows:
SVR = (Mean arterial pressure [MAP] − Central venous pressure [CVP])/CO × 80
The normal calculated SVR is approximately 800 to 1200 dyne second/cm5
Hypotension and Hemodynamics
As discussed, hypotension can occur as a consequence of a reduction in cardiac output, systemic vascular resistance, or both. Still, the differential diagnosis of perioperative hypotension listed in Table 2–1 is rather large. It is important to understand the physiologic principles underlying hemodynamic instability in order to work through the differential and make the appropriate diagnosis of “Why is the patient hypotensive?”
As a first step, one should measure the CO in order to calculate the SV. CO measurement can be obtained both invasively and noninvasively. Various methods and devices can be employed for the estimation of the CO.3–5 These approaches include estimation of CO based on changes in respiratory carbon dioxide concentration caused by a brief period of rebreathing in mechanically ventilated patients (NICO system) or using pulse contour analysis of arterial pressure tracings from the arterial line (Vigileo/FloTrac, PiCCO, Pulse CO, and Finapres). Many of these pulse contour analysis systems require calibration of their measurements with some other form of CO measure in order to be accurate.
Traditionally, the Swan-Ganz pulmonary artery catheter has been used to estimate CO. However, there are a number of reports, which question the risk/benefit of pulmonary artery (PA) catheter placement.6–9 Sandham et al6 reported no benefit in PA-guided therapy in ASA 3 or 4 patients scheduled for elective or urgent surgery as compared with patients not monitored with a PA catheter. Harvey et al showed no benefit in overall outcome in critically ill patients managed with a PA catheter compared to a less invasive CO measurement devices.7 Moreover, studies have questioned the need to specifically measure CO in the cardiac surgery patient.8,9 As will be discussed later in this chapter, TEE has reduced the need to place specific monitors for CO determination since echocardiography can itself be used to measure hemodynamic parameters.10
Although the use of CO measurements to guide therapy in critically ill patients may be controversial and the methods by which these measurements are obtained ever changing, the use of these measurements is likely to continue for some time in the perioperative period as academic debates rage. The goal of any measurement of CO is to ultimately determine the SV.
If the SV is elevated in the setting of hypotension it is likely that the patient is vasodilated. Conversely, if the SV is reduced and the patient is hypotensive then there are two fundamental possible etiologies to consider.
1. Abnormal pump function of the myocardium secondary to cardiomyopathy, ischemia, arrhythmia, valvular heart disease, etc.
2. Decreased preload secondary to hypovolemia, tension pneumothorax, or cardiac tamponade.
To distinguish between these two etiologies we need additional information from perioperative monitors.
Invasive Monitors
The cardiac surgical patient requires invasive arterial blood pressure monitoring as well as central venous access. As mentioned previously, the use of the PA catheter in this setting can be controversial but remains widely employed.
ARTERIAL MONITORING
There are perhaps as many varying techniques of arterial line placement as there are practitioners. Although approaches to arterial lines can be discussed and demonstrated there is no substitution for trial and error as trainees develop their own approaches to line placement. Table 2–2 lists sites for arterial cannulation. The Allen test has been suggested as an approach to screen out the possibility of hand ischemia should ulnar arterial blood flow be inadequate in the setting of radial artery cannulation. During the Allen test both radial and ulnar arteries are occluded and the hand is observed after developing pallor. The ulnar artery compression is released and the time for the hand to return to normal color noted. Should color fail to return to the hand after release of ulnar compression within 10 to 15 seconds the test is positive and radial arterial cannulation avoided. This test is, however, controversial and is not universally employed.11,12 Whatever site is chosen for line placement there is always the risk of arterial bleeding, hematoma, embolization, and thrombosis. Sterile techniques should be employed and the pressure tubing used to connect the arterial line to the monitoring system purged of any air. The pressurized bag containing the normal saline flush solution should be at a pressure greater than arterial pressure to prevent back bleeding through the arterial line. It should be noted that the arterial pressure waveform changes depending upon the cannulation site. As arterial lines are placed in more distal arteries, there is a change in the waveform with a progressive loss of the dicrotic notch, a delay in transmission, and a higher measure systolic pressure. MAP and diastolic blood pressure (DAP) are less affected by line placement.
Table 2–2. Arterial Cannulation Sites Helpful Hints
• Radial artery: Confirm radial artery not to be used for bypass grafts. • Femoral artery: Confirm absence of distal vascular disease; useful if intra-aortic balloon pump is planned: confirm the site is not to be used for planned or backup cannulation. • Axillary artery: A good alternative site if radials and femorals are unavailable. • Brachial artery: Risks of reduced arterial flow to the arm must be considered if this site is employed |
CENTRAL VENOUS ACCESS
Central access can be obtained through cannulation of the external jugular, internal jugular, subclavian, or femoral veins. Generally, the right internal jugular vein is cannulated due to ease of access and ease of flotation of the PA catheter should that be considered necessary (Figure 2–3).
Multiple complications may arise from obtaining central access. Infection is one of the most common complications and may lead to sepsis and multiple organ failure. The importance of using scrupulous sterile techniques must be emphasized, including the use of full body draping.13,14 Other complications include inadvertent carotid artery catheterization, neck hematoma and airway compromise, pneumothorax, and air embolism.
Confirmation that the central venous circulation, and not an artery, has been cannulated is essential prior to catheter placement. Numerous methods can be employed including:
• Color comparison between an arterial sample and one obtained from the proposed cannulation site. Inaccurate in the presence of left-right or right-left shunt or if the patient is being administered a high fraction of inspired oxygen.
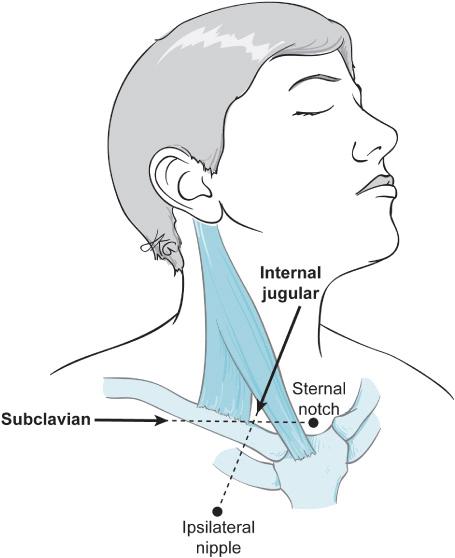
Figure 2–3. The subclavian and internal jugular veins are both used for central access perioperatively with the sternal notch and ipsilateral nipple in the direction of needle passage for each, respectively.
• Pressure measurements to determine venous waveform and pressure rather than arterial waveform and pressure at the cannulation site.
• Observation on TEE of wire placement in the right atrium (Video 2–1).
• Ultrasound-guided line placement (Video 2–2).
TEE confirmation of adequate central venous access requires some TEE prowess. Ultrasound-guided placement has been shown to reduce complications of line placement.15,16 Consequently, it is likely that ultrasound-guided placement will become even more common as a way of achieving central access. However, ultrasound equipment is expensive and may not be readily available. Should arterial cannulation occur consultation with the vascular surgeon is mandatory.
PULMONARY ARTERY CATHETERIZATION
After having secured adequate central venous access a PA (Swan-Ganz) catheter can be floated to assist in diagnosing the etiology of perioperative hypotension.17–19 It is paramount that, should a PA catheter or any other device be used for hemo-dynamic measurement, the information obtained be used in an informed manner. It is very likely that due to their ease of use, other less invasive means of estimating CO will be increasingly employed. At present, the PA catheter is readily available and as such remains a routine method for determining CO.
Risks of PA catheterization include pulmonary artery rupture, rhythm disturbances, complete heart block, and knotting of the catheter. Figure 2–4 demonstrates the expected pressure patterns as the pulmonary catheter passes from the central venous circulation through the right atrium, the right ventricle, the pulmonary artery and finally settles into the occlusive or wedge position. The PA catheter traditionally has aided patient management in two ways:
1. It allows measures of CO, SVR, and SV. CO measurements can be obtained using the thermodilution technique. The thermodilution technique determines cardiac output by using the temperature of the blood as an indicator. Cool saline is injected into a proximal port of the PA catheter. At the end of the catheter there is a thermistor that can detect the change in temperature as fluid passes by. The changes in temperature are then calculated by software incorporated and a CO is estimated. Some PA catheters are equipped with fiberoptic capabilities, which enable them to determine mixed venous oxygen saturation. Mixed venous oxygen saturation SvO2 is normally 65% to 75%. Mixed venous oxygen partial pressure is normally 40 mm Hg. The SvO2 may be measured in the blood gas lab by obtaining a blood sample from the distal PA port of the PA catheter. SvO2 represents the venous hemoglobin saturation in the pulmonary artery after the mixing of venous blood from the superior vena cava, the inferior vena cava, and the coronary sinus. The following hemodynamic formula defines the SvO2:
SvO2 = SaO2 − VO2/CO × 1.36 × Hb
where:
SaO2 = arterial oxygen saturation
Hb = hemoglobin concentration
VO2 = oxygen consumption
SvO2 is reduced in settings of increased extraction of oxygen by the tissues or decreased oxygen delivery to the tissues. This can occur in situations of reduced CO, anemia, or decreased arterial oxygen saturation. SvO2 is increased in situations of decreased utilization of oxygen in the tissues such as in cyanide poisoning, hemoglobin with a higher affinity for oxygen, or in the presence of left-to-right shunt.
2. Secondly, the PA catheter measures the pressure in the various chambers of the heart. The right atrial pressure (RAP) also known as the central venous pressure (CVP) estimates right ventricular filling. Elevated RAP > 20 mm Hg can be associated with right ventricular dysfunction.20–28 Additionally, trends in RAP are often used to determine the adequacy of volume replacement. Although static indicators of volume load such as RAP have been traditionally employed, dynamic parameters such as stroke volume variation, pulse pressure variation, and systolic pressure variation have more recently been used to infer the volume status. The transpulmonary thermodilution technique, employed by the PiCCO system, permits the calculation of the global end-diastolic volume index (GEDVI). Additionally the device permits measurement of the extra vascular lung water index (EVLWI) and may be useful in situations of volume overload and pulmonary edema. The normal GEDVI ranges between 640 mL/m2 and 800 mL/m2 with an EVLWI less than 10 mL/kg. Hence, the PiCCO system provides volume estimates of ventricular filling rather than the pressure measurements provided by the PA catheter. Goepfert et al have demonstrated the use of these volume measurements in the management of the cardiac surgical patient.22 The challenge of the anesthesiologist is to incorporate measures of pressures and volumes to guide therapy for hemodynamic instability.
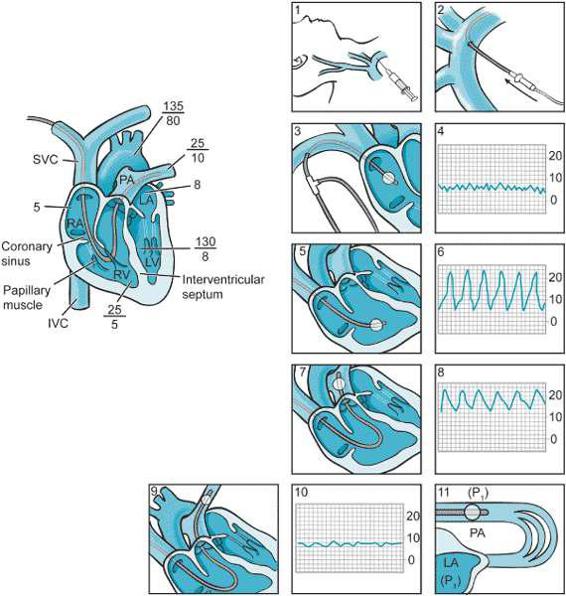
Figure 2–4. Although its utility is increasingly questioned, pulmonary artery catheters continue to be a part of perioperative management of the cardiac surgery patient. Following placement of a sheath introducer in the central circulation (panels 1, 2), the pulmonary artery catheter is “floated.” Central line placement should always be completed using rigorous sterile technique, full body draping, and only after multiple, redundant confirmations of the correct localization of the venous circulation. Pressure guidance is used to ascertain the localization of the PA catheter in the venous circulation and the heart. Upon entry into the right atrium (panel 3 and 4), the central venous pressure tracing is noted. Passing through the tricuspid valve (panel 5 and 6) right ventricular pressures are detected. At 35 to 50 cm depending upon patient size, the catheter will pass from the right ventricle through the pulmonic valve into the pulmonary artery (panel 7 and 8). This is noted by the measurement of diastolic pressure once the pulmonic valve is passed.
Lastly, when indicated the balloon-tipped catheter will “wedge” or “occlude” a pulmonary artery branch (panels 9, 10, 11). When this occurs, the pulmonary artery pressure equilibrates with that of the left atrium which barring any mitral valve pathology should be a reflection of left ventricular end-diastolic pressure. (From: Soni N. Practical Procedures in Anaesthesia and Intensive Care. Boston, MA: Butterworth Heinemann; 1994:43, with permission.)
Knowing these various pressures, volumes, and the SV it is possible to determine why a patient is hypotensive. But before doing that there is one critical concept that must be introduced and understood: ventricular compliance.
Compliance relates pressure and volume and is defined by the formula
C = ΔV/ΔP
Related posts:


Stay updated, free articles. Join our Telegram channel

Full access? Get Clinical Tree


