Hemodynamics
KEY POINTS
1 Because of differences in wall thickness and ejection impedance, the two sides of the heart differ in structure and sensitivity to preload and afterload. The normal right ventricle is relatively sensitive to changes in its loading conditions. When failing or decompensated, both ventricles are preload insensitive and afterload sensitive.
2 Right ventricle afterload is influenced by hypoxemia and acidosis, especially when the capillary bed is diminished and the vascular smooth musculature is hypertrophied, as in chronic lung disease. The ejection impedance of the left ventricle is conditioned primarily by vascular tone, wall thickness, and ventricular volume, except when there is an outflow tract narrowing or aortic valve dysfunction.
3 Regulating cardiac output to metabolic need requires appropriate values for average heart rate and stroke volume. Either or both may be the root cause of failing to do so.
4 Even when systolic function is well preserved, impaired ventricular distensibility and failure of the diseased ventricle to relax in diastole can produce pulmonary vascular congestion and “flash pulmonary edema.” Echocardiographic diastolic dysfunction often precedes heart failure and commonly develops against the background of systemic hypertension, ischemia, or other diseases that reduce left ventricular compliance.
5 The relationship of cardiac output to filling pressure can be equally well described by the traditional Frank-Starling relationship or by the venous return curve. The driving pressure for venous return is the difference between mean systemic pressure (the average vascular pressure in the systemic circuit) and right atrial pressure. Venous resistance is conditioned by vascular tone and by anatomic factors influenced by lung expansion. At a given cardiac output, mean systemic pressure is determined by venous tone and degree of vascular filling.
6 Radiographic evidence of acute heart failure includes perivascular cuffing, a widening of the vascular pedicle, blurring of the hilar vasculature, and diffuse infiltrates that spare the costophrenic angles. These infiltrates tend to lack air bronchograms and are usually unaccompanied by an acute change in heart size. Chronic congestive heart failure is typified by Kerley B lines, dilated cardiac chambers, and increased cardiac dimensions.
7 The key directives in managing cor pulmonale are to maintain adequate right ventricle filling, to reverse hypoxemia and acidosis, to establish a coordinated cardiac rhythm, to reduce oxygen demand, to avoid both over distention and derecruitment of lung tissue, and to treat the underlying illness.
8 Pericardial tamponade presents clinically with venous congestion, hypotension, narrow pulse pressure, distant heart sounds, and equalized pressures in the left and right atria. Diastolic pressures in both ventricles are similar to those of the atria.
▪ CHARACTERISTICS OF NORMAL AND ABNORMAL CIRCULATION
Anatomy
Cardiac Anatomy
The circulatory and respiratory systems are tightly interdependent in their primary function of delivering appropriate quantities of oxygenated blood to metabolizing tissues. The physician’s ability to deal with hemodynamic dysfunction requires a welldeveloped understanding of the anatomy and control of the circulation under normal and abnormal conditions. The bloodstream’s interface with the airspace (the alveoli) divides the circulatory path into two functionally distinct limbs—right, or pulmonary, and left, or systemic. Except during congestive
failure, the atria serve primarily as reservoirs for blood collection, rather than as key pumping elements. The right ventricle (RV) is structured differently than its left-sided counterpart (Table 1-1). Because of the low resistance of the pulmonary vascular bed, the normal RV generates mean pressures only one seventh as great as those of the left side while driving the same output. Consequently, the free wall of the RV is normally thin, preload sensitive, and poorly adapted to an acute increase of afterload. The thicker left ventricle (LV) must generate sufficient pressure to drive flow through a much greater and widely fluctuating vascular resistance. Because the RV and LV share the interventricular septum, circumferential muscle fibers, and the pericardial space, their interdependence has important functional consequences. For example, when the RV swells in response to increased afterload, the LV becomes functionally less distensible and left atrial pressure tends to increase. At the same time, the shared muscle fibers allow the LV to assist in generating the increased need for RV and pulmonary arterial pressures. Ventricular interdependence is enhanced by processes that crowd their shared pericardial fossa: high lung volumes, high heart volumes, and pericardial effusion.
failure, the atria serve primarily as reservoirs for blood collection, rather than as key pumping elements. The right ventricle (RV) is structured differently than its left-sided counterpart (Table 1-1). Because of the low resistance of the pulmonary vascular bed, the normal RV generates mean pressures only one seventh as great as those of the left side while driving the same output. Consequently, the free wall of the RV is normally thin, preload sensitive, and poorly adapted to an acute increase of afterload. The thicker left ventricle (LV) must generate sufficient pressure to drive flow through a much greater and widely fluctuating vascular resistance. Because the RV and LV share the interventricular septum, circumferential muscle fibers, and the pericardial space, their interdependence has important functional consequences. For example, when the RV swells in response to increased afterload, the LV becomes functionally less distensible and left atrial pressure tends to increase. At the same time, the shared muscle fibers allow the LV to assist in generating the increased need for RV and pulmonary arterial pressures. Ventricular interdependence is enhanced by processes that crowd their shared pericardial fossa: high lung volumes, high heart volumes, and pericardial effusion.
TABLE 1.1 RIGHT VERSUS LEFT HEART PROPERTIES | ||||||||||||||||||||||||||||||||||||||||||||||||||||||||||||||||||
|---|---|---|---|---|---|---|---|---|---|---|---|---|---|---|---|---|---|---|---|---|---|---|---|---|---|---|---|---|---|---|---|---|---|---|---|---|---|---|---|---|---|---|---|---|---|---|---|---|---|---|---|---|---|---|---|---|---|---|---|---|---|---|---|---|---|---|
| ||||||||||||||||||||||||||||||||||||||||||||||||||||||||||||||||||
Coronary Circulation
The heart is nourished by the coronary arteries, and its venous outflow drains into the coronary sinus that opens into the right atrium. The right coronary artery emerges anteriorly from the aorta, distributing to the RV, to the sinus and atrioventricular (AV) nodes, and to the posterior and inferior surfaces of the LV. The left coronary system (circumflex and left anterior descending arteries) nourishes the interventricular septum, the conduction system below the AV node, and the anterior and lateral walls of the LV. If the heart were to relax completely, the difference between mean arterial pressure (MAP) and coronary sinus pressure would drive flow through the coronary circulation. However, because aortic pressure varies continuously and because the tension within the myocardium that surrounds the coronary vessels influences the effective downstream pressure, perfusion varies with the phases of the cardiac cycle. The LV is perfused most actively in early diastole—not when aortic pressure is at its maximum but when myocardial tension is least. The LV myocardial pressure is highest close to the endocardium and lowest near the epicardium. Hence, under stress, the endocardium is more likely to experience ischemia.
Coronary blood flow normally parallels the metabolic activity of the myocardium. Because changes in heart rate are accomplished chiefly by shortening or lengthening diastole, tachycardia reduces the time available for diastolic perfusion while increasing the heart’s need for oxygen. This potential reduction in mean coronary flow is normally overridden by vasodilatation. However, coronary disease prevents full expression of such compensation. During bradycardia, longer periods of time are available for diastolic perfusion and metabolic needs are less. However, diastolic myocardial fiber tension rises as the heart expands, and marked bradycardia may lower both mean arterial and coronary perfusion pressures.
Vascular Anatomy
Left Side
Between heartbeats, the continuous flow of blood from the heart to the periphery is maintained by the recoil of elastic vessels that were distended during systole. Arterioles serve as the primary resistive elements, and by adjusting their caliber, these small vessels regulate tissue blood flow and aid in the control of arterial pressure. The true capacitance vessels of the circulation are the venules and small veins. At any one time, only a small percentage of the total capacitance bed is recruited or distended. The precise distribution of the circulating blood volume among various tissue beds is governed by metabolic or functional requirements and gated by arteriolar vasoconstriction.
Right Side
In the low-pressure pulmonary circuit, relatively few structural differences distinguish normal arteries from veins. The pulmonary capillary meshwork, however, is even more luxuriant than in the periphery. Apart from innate anatomy, blood flow distribution is influenced by gravity, alveolar pressure, regional pleural pressures, oxygen tension, pH, circulating mediators, and chemical stimuli (e.g., nitric oxide).
Circulatory Control
Determinants of Cardiac Output
When averaged over time, cardiac output (product of heart rate and stroke volume) must match the metabolic requirements. In a real sense, metabolic activity regulates the cardiac output of a healthy individual; insufficient cardiac output activates inefficient anaerobic metabolism that cannot be sustained indefinitely. Agitation, anxiety, pain, shivering, fever, and increased breathing workload intensify systemic O2 demands. In the critical care setting, matching output to demand is often achieved with the help of sedative, analgesic, antipyretic, inotropic, or vasoactive agents. It is important to remember that increasing or decreasing cardiac output can reflect shifting O2 demands, rather than a change in ventricular loading conditions or response to therapeutic intervention.
Although the precise mechanism that links output to metabolism remains uncertain, the primary determinants of stroke volume are well defined: precontractile fiber stretch in diastole (preload), the tension developed by the muscle fibers during systolic contraction (afterload), and the forcefulness of muscular contraction under constant loading conditions (contractility) (Fig. 1-1). Factors governing these determinants, as well as their normal values, differ for the two ventricles, even though over time the average stroke volume of both ventricles must be equivalent.
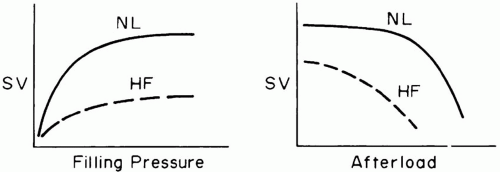 ▪ FIGURE 1-1 Stroke volume (SV) response of normal (NL) and failing heart (HF) to loading conditions. Impaired hearts are abnormally sensitive to afterload, but show blunted responses to preload augmentation. |
Determinants of Stroke Volume—General Concepts
Preload
According to the Frank-Starling principle, muscle fiber stretch at end-diastole influences the vigor of cardiac contraction. The tendency of ejected volume to increase as the transmural filling pressure rises normally constitutes an important adaptive mechanism that enables moment-by-moment adjustments to changing venous return. During heart failure, the Starling curve flattens, and the ventricle becomes preload insensitive—higher filling pressures become necessary to achieve a similar output. Although preload parallels end-diastolic ventricular volume, myocardial remodeling can gradually modify the relationship between absolute chamber volume and preload. Therefore, muscle fiber stretch within a chronically dilated heart may not differ significantly from normal. End-diastolic volume is determined by ventricular compliance and by the pressure distending the ventricle (the transmural pressure). Transmural pressure is the difference between the intracavitary and juxtacardiac pressures. In comparison to the LV, the normal RV operates with a comparatively steep relationship between transmural pressure and ventricular volume. A poorly compliant ventricle, or one surrounded by increased intrathoracic or pericardial pressure, requires a higher intracavitary pressure to achieve any specified enddiastolic volume and degree of precontractile fiber stretch (Fig. 1-2). The cost of higher filling pressure may be impaired myocardial perfusion or
pulmonary edema. Functional ventricular stiffening can result from myocardial disease, pericardial tethering, or extrinsic compression of the heart (Table 1-2). The precise position of the ventricle on the Starling curve is difficult to determine. However, studies of animals and normal human subjects suggest that there is little preload reserve in the supine position, and that, once supine, further increases in cardiac output are met primarily by increases in heart rate and/or ejection fraction. Thus, the Frank-Starling mechanism may be of most importance during hypovolemia and in the upright position.
pulmonary edema. Functional ventricular stiffening can result from myocardial disease, pericardial tethering, or extrinsic compression of the heart (Table 1-2). The precise position of the ventricle on the Starling curve is difficult to determine. However, studies of animals and normal human subjects suggest that there is little preload reserve in the supine position, and that, once supine, further increases in cardiac output are met primarily by increases in heart rate and/or ejection fraction. Thus, the Frank-Starling mechanism may be of most importance during hypovolemia and in the upright position.
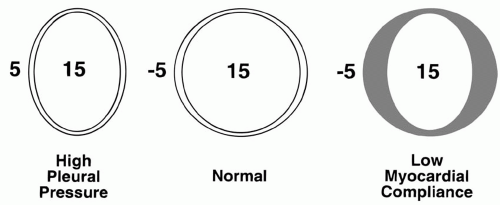 ▪ FIGURE 1-2 Concept of transmural pressure. The muscle fiber tensions that determine preload and afterload are developed by pressure differences across the ventricle. For example, in diastole, a measured intracavitary pressure of 15 mm Hg may correspond to a large or small chamber volume and myocardial fiber tension, depending on the compliance of the ventricle and its surrounding pressure. |
Diastolic Dysfunction
Diastole is usually considered a passive process in which transmural pressure distends elastic heart muscle. In normal individuals and many patients with heart disease, this approximation is more or less accurate. However, diastole is more properly considered an energy-dependent active process. (In fact, in some instances, more myocardial oxygen may be consumed in diastole than in systole.) Failure of the heart muscle to relax at a normal rate (secondary to ischemia, long-standing hypertension, or hypertrophic myopathy) can cause sufficient functional stiffening to produce pulmonary edema despite preserved systolic function. As defined by echocardiography, many apparently normally functioning elderly adults have abnormal patterns of cardiac relaxation. Perhaps one third or more of adult patients with congestive heart failure (CHF) develop symptoms on this basis, with the incidence increasing markedly with advancing age. Key echocardiographic features of diastolic dysfunction are described in Chapter 2. Diastolic dysfunction often precedes systolic dysfunction and should be considered an early warning sign of deterioration. Although diastolic and systolic impairments often coexist, the diastolic dysfunction syndrome is an especially likely explanation when signs of pulmonary congestion predominate over those of systemic perfusion. In all patients with diastolic dysfunction, the early rapid filling phase of ventricular diastole is slowed, and the extent of ventricular filling becomes more heavily influenced by terminal-phase atrial contraction. Sudden loss of the atrial “kick” often precipitates congestive symptoms. “Flash pulmonary edema” is often the consequence of sudden diastolic dysfunction resulting from ischemia, tachycardia, or atrial fibrillation. Diastolic dysfunction should be suspected when congestive symptoms develop despite normal systolic function in predisposed patients. Confirmation requires ancillary testing by echocardiography, Doppler ultrasound, radionuclide angiography, contrast ventriculography, or other imaging method. With all techniques, attention must be focused on diastole, particularly during the phase of rapid filling. In most institutions, echocardiography has become the method of choice for critically ill patients due to its convenience and reliability. Indicators of mitral valve function such as deceleration time, early diastolic (E) to late diastolic (A) wave velocity ratio, and isovolume relaxation time are helpful. Signals of the required clarity are often impossible to obtain,
however, in the critically ill patient, particularly with transthoracic (as opposed to transesophageal) imaging. Regarding treatment, control of blood pressure, heart rate, and ischemia are the essential objectives. Diuretics are indicated to relieve congestive symptoms. Calcium channel blockers (e.g., verapamil, diltiazem, nifedipine) have been demonstrated to be useful in animal studies and in humans with hypertrophic cardiomyopathy. Selective β-blockers (e.g., metoprolol, carvedilol) can help reduce tachycardia, lower blood pressure, and promote long-term remodeling, but must be chosen wisely and used with extreme caution when significant systolic dysfunction, conduction system disturbance, or bronchospasm coexist. Predictably, inotropes do not improve the diastolic function.
however, in the critically ill patient, particularly with transthoracic (as opposed to transesophageal) imaging. Regarding treatment, control of blood pressure, heart rate, and ischemia are the essential objectives. Diuretics are indicated to relieve congestive symptoms. Calcium channel blockers (e.g., verapamil, diltiazem, nifedipine) have been demonstrated to be useful in animal studies and in humans with hypertrophic cardiomyopathy. Selective β-blockers (e.g., metoprolol, carvedilol) can help reduce tachycardia, lower blood pressure, and promote long-term remodeling, but must be chosen wisely and used with extreme caution when significant systolic dysfunction, conduction system disturbance, or bronchospasm coexist. Predictably, inotropes do not improve the diastolic function.
TABLE 1-2 REDUCED DIASTOLIC COMPLIANCE | ||||||||||||||||||
|---|---|---|---|---|---|---|---|---|---|---|---|---|---|---|---|---|---|---|
|
Afterload
Although afterload is often equated with elevations of blood pressure or vascular resistance, it is better defined as the muscular tension that must be developed during systole per unit of blood flow. As such, the systolic wall stress is affected by blood pressure, wall thickness, and ventricular volume. In the normal heart, moderate changes in afterload are usually countered by increases in contractility, preload, or heart rate, so that forward output is usually little affected. Heart size remains small, and filling pressures do not rise excessively. However, once preload reserves have been exhausted, raising afterload can profoundly depress cardiac output if contractile force and/or heart rate do not compensate. Just as the relationship between preload and stroke volume rises more steeply for the right than for the LV, so too is the normal RV more sensitive than the left to changes in afterloading (Fig. 1-1). The dilated chambers of a failing heart—both right and left— are inherently afterload sensitive (Fig. 1-1). Cardiomegaly and mitral regurgitation are clinical findings that help identify potential candidates for afterload reduction. Quantitative assessment of ejection impedance can be made by determining pulmonary (PVR) and systemic vascular resistance (SVR). These indices, the quotients of driving pressure and cardiac output across their respective beds, are calculated as if the blood flow fulfilled the assumptions of Poiseuille’s law. Because cardiac output must be interpreted relative to body size, both indices have a wide range of normal values. Although SVR rising in response to adrenergic tone or drug treatment helps support the upstream arterial pressure that perfuses critical tissue beds when cardiac output falls (e.g., kidney), elevating vascular resistance may impair downstream capillary filling in others. Moreover, in aggregate, vascular impedance may rise sufficiently to compromise cardiac output. Judicious reduction of arterial vessel tone may then allow cardiac output to improve and vital organ perfusion to increase, while maintaining an acceptable blood pressure. Chamber diameter also impacts afterload. In a dilated chamber, higher systolic fiber
tension must be generated to produce a given intracavitary pressure, especially in fibers on the periphery. Thus, a diuretic or selective venodilator (nitroglycerine) may reduce afterload as well as preload. Apart from vessel length and diameter, blood viscosity is an important determinant of rheology and effective afterload. Blood viscosity rises nonlinearly with hematocrit. With increasing hematocrit, crowded erythrocytes pass more sluggishly through tissues and effective O2 transport eventually reaches a maximum, the value of which depends on circulating blood volume relative to vascular capacity (Fig. 1-4). Individual tissues appear to have different tolerances to changes in hematocrit and different optimal values for oxygen extraction. Viscosity may also rise dramatically in the settings of hypothermia or hyperproteinemia.
tension must be generated to produce a given intracavitary pressure, especially in fibers on the periphery. Thus, a diuretic or selective venodilator (nitroglycerine) may reduce afterload as well as preload. Apart from vessel length and diameter, blood viscosity is an important determinant of rheology and effective afterload. Blood viscosity rises nonlinearly with hematocrit. With increasing hematocrit, crowded erythrocytes pass more sluggishly through tissues and effective O2 transport eventually reaches a maximum, the value of which depends on circulating blood volume relative to vascular capacity (Fig. 1-4). Individual tissues appear to have different tolerances to changes in hematocrit and different optimal values for oxygen extraction. Viscosity may also rise dramatically in the settings of hypothermia or hyperproteinemia.
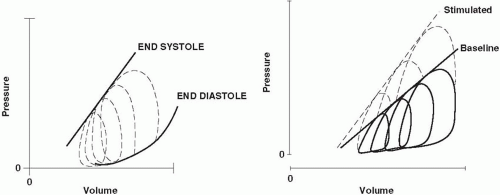 ▪ FIGURE 1-3 Transmural ventricular pressure volume loops. Left: Four complete cardiac cycles are represented for different states of ventricular filling. The end-diastolic pressure volume relationship (EDPVR) defines the Frank-Starling curve. During each cycle, there are sequential stages of diastolic filling, isovolumic contraction, active systolic ejection, and isovolumic relaxation. The end-systolic pressure volume relationship (ESPVR) correlates well with contractility. Right: As the myocardium is stimulated by catecholamines, the slope of the ESPVR increases, resulting in a greater pressure and ejection fraction during systole for any degree of diastolic filling. |
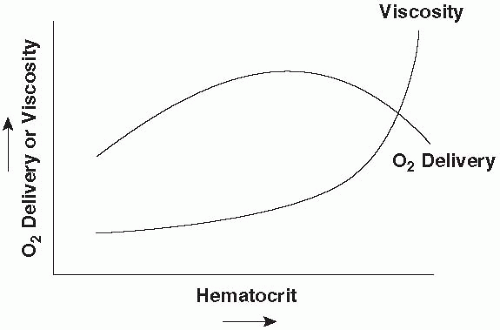 ▪ FIGURE 1-4 Hypothetical relationship of O2 delivery to hematocrit and viscosity. As hematocrit rises, O2 delivery increases up to the point at which increasing viscosity slows the transit of oxygenated blood through the tissues and/or impairs cardiac output. The precise value of hematocrit at which O2 delivery peaks is a function of circulating blood volume, shifting to lower values in the setting of volume contraction.
Related posts:Stay updated, free articles. Join our Telegram channel
Full access? Get Clinical Tree
 Get Clinical Tree app for offline access

|


