Hemodynamic Monitoring
KEY POINTS
1 Arterial blood pressure monitoring is an invaluable aid to the management of patients with hemodynamic instability, respiratory compromise, or brain injury and should be strongly considered in those who are in need of frequent BP or arterial blood gas assessment. It is always wise to compare readings obtained from an arterial line with those of a cuff pressure (preferably in more than one limb), and to do so whenever the monitored number disagrees with the clinical impression. Certain modern instruments allow online assessment of arterial blood gases and pH as well as provide reliable data for hemodynamic evaluation.
2 Before using hemodynamic information derived from catheter measurements, the transducer system must be accurately zeroed and calibrated. The dynamic pressure response of the catheter-transducer system should be checked by the rapid flush technique (“snaptest”).
3 As opposed to a damped pulmonary artery tracing, a true wedge pressure is significantly less pulsatile and has a value lower than the mean pulmonary artery pressure.
4 All pulmonary artery pressures are influenced to varying degrees by fluctuations in pleural pressure. Respiratory fluctuations of pleural pressure are conditioned by the alveolar pressure transmission fraction: Cl/(Cl + Cw). Major respiratory efforts may cause the end-expiratory wedge pressure value to exceed the relaxed value. During active breathing, the mean, nadir, and postparalysis wedge pressures reflect left ventricle filling and pulmonary vascular pressures better than the traditional end-expiratory wedge pressure.
5 It is always hazardous to infer the status of a dynamic system from a single number. The monitored “challenge” is a key maneuver in determining hemodynamic reserves. This may involve reversible noninvasive maneuvers (e.g., a change of positive end-expiratory pressure, measurement of respiratory pulse pressure variation, leg lifting) or rapid fluid bolusing. During a rigorous fluid challenge, the clinician notes symptoms, physical signs, cardiac output, blood pressure, wedge pressures, and /or pulmonary artery pressure in response to a fluid bolus. A notable improvement in key target variables (cardiac output, systemic blood pressure) without the development of symptoms or excessive cardiac filling pressures encourages an increase in the rate of fluid administration.
6 The complete hemodynamic profile should include sampling of mixed-venous (or less desirably, central venous) blood, a comparison of central venous and pulmonary artery wedge pressures, and calculations of systemic vascular resistance and pulmonary vascular resistance. Without such information, adequacy of cardiac output and mechanisms of hemodynamic impairment are often difficult to determine.
7 Echocardiogram provides vital data that compliment catheterization and physical examination. Wall motion abnormalities, ventricular contractility, chamber dimensions, dynamics of the central veins, diastolic properties, and valve functioning are well evaluated by this noninvasive method. Pulmonary artery pressure estimation is often possible. Although the relative importance of the pulmonary artery catheter has faded as echocardiogram and other minimally invasive hemodynamic monitoring techniques have been perfected for bedside use, the Pulmonary Artery (Swan Ganz) catheter remains an excellent option for well-selected patients whose clinicians understand the physiologic data stream it provides.
▪ ARTERIAL BLOOD PRESSURE MONITORING
Noninvasive Arterial Pressure Monitoring
Sphygmomanometer pressures are notoriously inaccurate when cuff width is less than two thirds of arm circumference. Spurious elevations of blood pressure (BP) occur when measurements are made with an inappropriately narrow cuff and when arteriosclerosis prevents the brachial artery from collapsing under pressure. Conversely, because tight proximal occlusions can artifactually lower the BP, BP should initially be checked in both arms. As noted, it is always wise to compare readings obtained from an arterial line with a cuff pressure periodically and whenever the monitored number disagrees with the clinical impression. In many hypotensive patients with low cardiac output (CO), the “muffle” and disappearance points of diastolic pressure are poorly audible. In shock, all Korotkoff sounds may be lost. In this setting, Doppler ultrasonography may detect systolic pressures below the audible range.
The Arterial Pressure Waveform
Normally, mean arterial pressure (MAP) is similar in all large arterial vessels of a supine subject; there is only a slight pressure gradient between aortic and radial vessels. Posture-related hydrostatic increases of pressure are shared equally between arteries and veins, so that perfusion pressure is little affected. Although MAP is largely the same throughout the arterial tree, waveform contours differ with the caliber of the arterial vessel in question. Peak systolic pressure actually rises in the periphery due to wave reflection. When a vessel is totally occluded by a monitoring catheter, wave reflection may amplify pressure fluctuations to produce sharp spikes of systolic arterial pressure (to over 300 mm Hg in some cases) (Fig. 2-1). The ability of any specific gradient between arterial and venous pressures to perfuse tissue depends directly on the resistance of the vascular bed. An MAP of 60 mm Hg may produce luxuriant flow through dilated vascular beds, whereas an MAP of 100 mm Hg may be inadequate during accelerated hypertension.
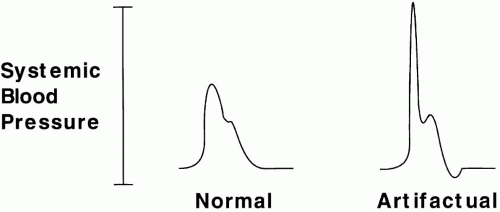 ▪ FIGURE 2-1 Artifactual elevation of systolic arterial pressure. An underdamped arterial pressure tracing amplified by reflection within an occluded artery may exaggerate the systolic pressure as well as any mean pressure computed from the raw “systolic” and diastolic pressure values. |
Depending on the shape of the arterial pressure waveform, the peak systolic (PS) and nadir diastolic (PD) pressures contribute to varying degrees to MAP. At normal heart rates (60 to 100 beats/min), MAP ≈ PD + 1/3 (PS − PD). During tachycardia, PS contributes relatively more, and during bradycardia, relatively less. Because its duration is generally longer, the diastolic pressure is the most important contributor to MAP.
Arterial Waveform Analysis for Cardiac Output Estimation
It is important to remember that pressure imperfectly indexes flow: unlike pressure, flow is largely continuous, not pulsatile. However, though not appropriate for patients with irregular rhythms and shock states, monitoring devices that analyze the shape of the arterial pressure waveform do a creditable job during sinus rhythm of tracking and trending the CO within their limitations. Their value is seriously compromised by atrial fibrillation and other chaotic arrhythmias.
Simplified Functional Hemodynamic Monitoring
Useful classification of hemodynamic compromise can be attempted using a few simple bedside observations that determine mean arterial pressure and index stroke volume. The arterial pressure waveform is central to such an analysis in that it provides the mean arterial pressure and the stroke volume variation of respiration that indexes the sufficiency of intravascular volume (Fig. 2-2). A >10% change of pulse pressure with passive respiration
suggests the need for additional preload. PPV(%) = 100 × [PPmax − PPmin]/[PPmax + PPmin/2]. It must be borne in mind, however, that arrhythmias and active breathing negate the value of pulse pressure variation. With this proviso, combining an evaluation of mean arterial pressure and variation of pulse pressure can yield an insight into the type of therapy indicated. A low mean arterial pressure combined with a low stroke volume (as indicated by wide pulse pressure variation) strongly suggests hemorrhage, heart failure, or tamponade. A low MAP combined with negligible pulse pressure variation is more compatible with sepsis. The responses of these indices to a reversible volume challenge intervention (such as lifting the legs with the upper torso horizontal) can also help to identify the appropriate therapeutic approach.
suggests the need for additional preload. PPV(%) = 100 × [PPmax − PPmin]/[PPmax + PPmin/2]. It must be borne in mind, however, that arrhythmias and active breathing negate the value of pulse pressure variation. With this proviso, combining an evaluation of mean arterial pressure and variation of pulse pressure can yield an insight into the type of therapy indicated. A low mean arterial pressure combined with a low stroke volume (as indicated by wide pulse pressure variation) strongly suggests hemorrhage, heart failure, or tamponade. A low MAP combined with negligible pulse pressure variation is more compatible with sepsis. The responses of these indices to a reversible volume challenge intervention (such as lifting the legs with the upper torso horizontal) can also help to identify the appropriate therapeutic approach.
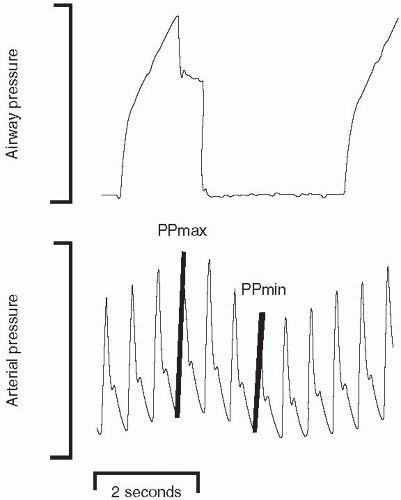 ▪ FIGURE 2-2 Changes in pulse pressure variation with respiration in a passively ventilated subject. The relatively large difference in pulse pressure during different phases of the ventilation cycle suggests relative underfilling of the vasculature. |
Invasive Arterial Pressure Monitoring
Indications
The decision to initiate invasive arterial monitoring must be undertaken cautiously. Many critically ill patients can be adequately monitored by intermittent sphygmomanometry (manual or automated) in combination with the physical exam. Patients with hemodynamic instability or shock, malignant hypertension, or failure to oxygenate are most likely to benefit from arterial cannulation. A well-adjusted catheter system provides accurate pressure information necessary for hemodynamic monitoring and facilitates blood sampling, often obviating the need for venipuncture.
Although convenient and usually reliable, indwelling arterial catheters occasionally give misleading information—especially when the radial artery has been cannulated for an extended time. Errors are most likely to arise in patients who are elderly, are hypotensive, or have underlying vascular disease. Attempts should be made at least once daily to confirm the line pressure by sphygmomanometry. This is especially important in patients receiving vasoactive drugs regulated by radial line pressures. Consideration should be given to measuring femoral pressure when the cuff-derived value and clinical impression disagree seriously with the recorded value (generally in the direction of indicating greater pressure than the catheter records).
Complications
Serious complications can arise due to local hemorrhage, infection, and thrombosis. For this reason, the radial artery of the nondominant arm should be used whenever possible. Although common, regional thrombosis of the radial artery seldom results in tissue-damaging ischemia; digital embolization is the greater hazard. Large catheter size, low CO, preexisting arteriopathy, absence of collateral perfusion, and vasopressors increase the risk (artery caliber tends to parallel the wrist size).
The Allen test is performed by raising the wrist well above the heart level and compressing the radial and ulnar arteries simultaneously for 10 s, blanching the capillary bed. When the ulnar artery is then released, flushing should occur within a few seconds. Not all patients in shock can be tested in this fashion, as sluggish flow may falsely suggest a high risk when none exists. Conversely, although a positive Allen test (see following) is reassuring, it does not preclude the development of ischemic damage following radial artery thrombosis. A 20-gauge Teflon catheter is preferred for arterial measurements and sampling because it facilitates insertion, minimizes the risk of thrombosis, and tends to exhibit the best dynamic frequency response. Larger catheters occlude the vessel, creating standing waves while smaller-gauge catheters tend to kink or clot off. Rarely, the arterial catheter
may erode the vessel wall to cause aneurysm, localized hematoma, compressive neuropathy, or arteriovenous fistula. Although local colonization is very common, serious soft tissue infections are rare during percutaneous cannulation if the puncture site is kept sterile, the catheter is used for only a few days, and precautions are taken during blood sampling to preserve sterility. Femoral catheters and “cutdowns” are most likely to infect. The radial artery is not an appropriate site for injection of any drug. Intra-arterial injections of certain drugs, particularly calcium channel blockers and vasopressors, can cause ischemic necrosis of the hand, a functionally devastating injury. Prolonged, high pressure flushing can potentially drive clot or gas bubbles retrograde to produce cerebral embolism.
may erode the vessel wall to cause aneurysm, localized hematoma, compressive neuropathy, or arteriovenous fistula. Although local colonization is very common, serious soft tissue infections are rare during percutaneous cannulation if the puncture site is kept sterile, the catheter is used for only a few days, and precautions are taken during blood sampling to preserve sterility. Femoral catheters and “cutdowns” are most likely to infect. The radial artery is not an appropriate site for injection of any drug. Intra-arterial injections of certain drugs, particularly calcium channel blockers and vasopressors, can cause ischemic necrosis of the hand, a functionally devastating injury. Prolonged, high pressure flushing can potentially drive clot or gas bubbles retrograde to produce cerebral embolism.
▪ DATA FROM VASCULAR CATHETERS
In a certain sense, concern for the performance or stability of the cardiorespiratory system helps define the need for intensive care. Reliable data relevant to the heart and vasculature are instrumental in diagnosing problems, in selecting and regulating therapy, and in timing interventions. Yet, interpreting the complex relationships among vascular pressures and flows is often complicated by spontaneous fluctuations in metabolism and by variations of the respiratory pressures that influence them. Relatively few clinicians become expert in data interpretation. Balloon flotation pulmonary artery (PA) catheters have been relegated to a secondary status with the recognition that echocardiography (ECHO), noninvasive CO monitoring (e.g., arterial waveform analyzers), and information from central venous pressure (CVP) catheters—conventional and specially modified— suffice for many purposes. Yet, the PA catheter provides data of clinical value that cannot be obtained otherwise (e.g., pulmonary venous pressure and true mixed venous oxygen saturation). Moreover, because the PA catheter incorporates the CVP and requires similar insertion principles, it serves as an appropriate focal point for our discussion.
Inserting the Balloon Flotation Catheter
Although detailed descriptions of insertion technique for the balloon flotation catheter are available elsewhere, a few points are worth emphasizing here. In patients with bleeding disorders, the physician should select a site conducive to applying direct pressure. As opposed to the subclavian and femoral sites, the internal jugular approach tends to be the simplest and least fraught with complications. The right side provides more direct and reliable access to the superior vena cava (SVC) than the left, but either approach can be used effectively. For puncture of the internal jugular or subclavian veins, insertion must be accomplished with the patient supine or, preferably, in the Trendelenburg position to ensure vessel distention and minimize the risk of air embolism. In a dyspneic patient with orthopnea, this may require prior sedation and endotracheal intubation. If intubation is not an option, the femoral or brachial approach should be considered.
Difficult Insertion and Placement
Problems that occur during placement are generally of two types: (a) difficulty entering the central veins of the thorax and (b) difficulty directing the catheter tip into the PA. Both types of problem can be mastered only by gaining sufficient direct experience. With regard to central vein entry, placement of the introducer/sheath assembly is the crucial step. Ultrasonic imaging with a purpose-designed instrument is a valuable aid in locating the vein, monitoring the puncture, and avoiding complications. Sheath insertion must be gentle and never forced. The stab incision made to facilitate the puncture must be sufficiently long and deep to allow easy passage of the easily collapsible and damaged sheath over the introducer. Apart from anatomic aberrations (e.g., prior vascular trauma or clotting), common reasons for difficulty encountered in floating the catheter tip to proper position include low CO, severe pulmonary hypertension with right ventricular (RV) overload and tricuspid regurgitation, and massive RV enlargement. The balloon should always be inflated cautiously and must fill easily without the need for force. If blood does not draw easily through the sheath assembly, concern is raised for extravascular placement. No catheter or sheath placed via the right internal jugular should cross the midsternal line on a well-centered routine pulmonary arterial chest film. While pulsatile blood flow raises the possibility of inadvertent arterial cannulation, it should be kept in mind that the jugular vein lies in close proximity to the innominate and carotid arteries. Therefore, patients with well-filled central veins as well as those with tricuspid regurgitation may exhibit impressively pulsatile blood flow from a well-placed CVP catheter.
When the catheter is inserted via the right internal jugular vein, the balloon is inflated approximately 15 cm from the point of neck entry. Patients
vary with regard to the dimensions of their vascular anatomy, but as a rule of thumb, the catheter tip should not require advancement by more than 20 cm beyond its current position before encountering the next vascular compartment (Fig. 2-2). In other words, an SVC tracing should be evident within 20 cm of skin entry, and the RV should be entered within 40 cm. The PA should be encountered within the first 60 cm of tip advancement (often considerably less). Coiling within the RV and misdirection of the catheter should be suspected after 45 to 50 cm has been advanced without securing an appropriate PA waveform. To facilitate placement, the patient can be repositioned (e.g., lateral decubitus or Fowler’s) in an attempt to establish favorable balloon orientation and blood streaming for balloon flotation. Fluoroscopy can be a helpful adjunct in difficult cases and is especially worthwhile to consider before attempting an insertion of a PA catheter from a femoral site, which tends to present more placement problems than brachial, subclavian, or jugular punctures.
vary with regard to the dimensions of their vascular anatomy, but as a rule of thumb, the catheter tip should not require advancement by more than 20 cm beyond its current position before encountering the next vascular compartment (Fig. 2-2). In other words, an SVC tracing should be evident within 20 cm of skin entry, and the RV should be entered within 40 cm. The PA should be encountered within the first 60 cm of tip advancement (often considerably less). Coiling within the RV and misdirection of the catheter should be suspected after 45 to 50 cm has been advanced without securing an appropriate PA waveform. To facilitate placement, the patient can be repositioned (e.g., lateral decubitus or Fowler’s) in an attempt to establish favorable balloon orientation and blood streaming for balloon flotation. Fluoroscopy can be a helpful adjunct in difficult cases and is especially worthwhile to consider before attempting an insertion of a PA catheter from a femoral site, which tends to present more placement problems than brachial, subclavian, or jugular punctures.
Interpreting Data from the Pulmonary Artery Catheter
The balloon flotation catheter allows acquisition of three types of primary data: (a) central venous, PA, and balloon-occluded (wedge) pressures; (b) intermittent or continuous CO determinations; and (c) sampling of mixed-venous or postalveolar capillary blood. This information can be used in its primary form or can be manipulated to provide useful indices of fluid volume status, right and left ventricular (LV) performance and loading conditions, or tissue perfusion (Table 2-1). Specially modified fiberoptic CVP catheters provide O2 saturation data from the SVC in addition to CVP.
In recent years, justifiable concern has been raised that PA catheters often impair rather than improve the outcome of critical illness. An influential retrospective analysis of a large database published in the mid-1990s suggested that patients of equivalent severity were more likely to die when a catheter was used than when it was not. The data did not substantiate the suspicion that the instrument itself produced lethal illness by sepsis, balloon rupture of a pulmonary vessel, or other specific mechanism. Apprehension regarding its use was reinforced, however, by studies conducted in North America and Europe that revealed how inexpertly the data from the catheter were interpreted by critical care specialists. Although a general consensus has since emerged that PA catheters often provide important, therapy-guiding information, there is also agreement that the potential for iatrogenic injury is considerable and that numerous concepts of cardiopulmonary physiology must be mastered to interpret its data effectively. A recent NIH ARDSnet trial of fluids and catheter strategies demonstrated no survival benefit or harm with use of the PA catheter.
TABLE 2-1 HEMODYNAMIC DATA PROVIDED BY THE PA CATHETERa | ||||||||||||||||
|---|---|---|---|---|---|---|---|---|---|---|---|---|---|---|---|---|
| ||||||||||||||||
Pulmonary Vascular Pressures
Measurement of Pulmonary Vascular Pressures
Used in conjunction with the CO, the PA and wedge pressures yield important diagnostic information regarding intravascular filling, the tendency for pulmonary edema formation, the status of the pulmonary vasculature, and the vigor of LV contraction. This time-honored technique, although currently under assault from less-invasive methods and nowadays less commonly employed, often provides data of great value in assessing the relative function of the ventricles and the hydrostatic contribution of left heart failure and central vascular pressures to lung edema.
System Requirements for Accurate Pressure Measurement
Static Requirements
Zeroing Accurate recording of intravascular pressure requires error-free measurement of static pressure and faithful tracking of an undulating (dynamic) waveform. Attention must be paid to the technical details of data acquisition to avoid error. For wedge pressure recording, for example, an uninterrupted fluid column must extend from the left atrium (LA) through the catheter lumen to the flexible diaphragm of an electromechanical transducer. The transducer membrane deforms in response to pressure exerted by the fluid column
and generates proportional electrical signals for amplification and display. Because this segment of the system is fluid filled, the vertical distance separating the LA from the transducer exerts a hydrostatic pressure against the sensor that adds to or subtracts from the actual (LA) pressure (Fig. 2-3). To eliminate bias from positioning, the transducer is placed at the LA level. The display is then adjusted to read zero pressure when the dome is closed to the patient and opened to the atmosphere. Neither the transducer level relative to the LA nor the zero offset adjustment can be changed without a new “rezeroing” procedure. A similar caution to assure accuracy of positioning and zeroing applies to systemic arterial pressure monitoring. Sudden changes of systemic pressures are sometimes explained by movement of the transducer in relation to its originally zeroed position.
and generates proportional electrical signals for amplification and display. Because this segment of the system is fluid filled, the vertical distance separating the LA from the transducer exerts a hydrostatic pressure against the sensor that adds to or subtracts from the actual (LA) pressure (Fig. 2-3). To eliminate bias from positioning, the transducer is placed at the LA level. The display is then adjusted to read zero pressure when the dome is closed to the patient and opened to the atmosphere. Neither the transducer level relative to the LA nor the zero offset adjustment can be changed without a new “rezeroing” procedure. A similar caution to assure accuracy of positioning and zeroing applies to systemic arterial pressure monitoring. Sudden changes of systemic pressures are sometimes explained by movement of the transducer in relation to its originally zeroed position.
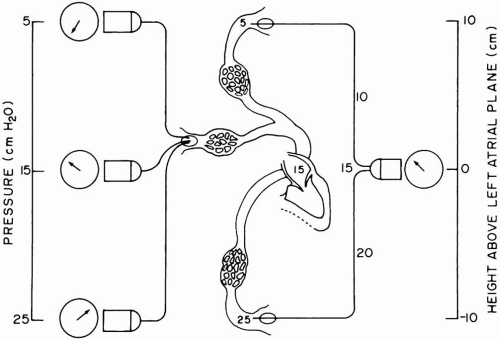 ▪ FIGURE 2-3 Zeroing the transducer. The transducer must not be moved from its original position after the display has been adjusted to record zero pressure with the liquid-filled system exposed to atmospheric pressure at the LA level. After zeroing, a hydrostatic column influences the recorded value when the transducer is lifted or lowered from its original position (left). Conversely, when the transducer remains at the “zeroed” position (right), movement of the catheter tip makes no difference to the pressure recorded, provided that a continuous column of fluid extends from the LA through the catheter to the transducer dome. |
Calibration Once the transducer is balanced (zeroed) to the LA level, the system must be accurately calibrated. With most modern systems, this can be accomplished automatically by the electronic processing equipment itself. In older systems, a known pressure is manually applied to the transducer membrane to complete the calibration. This is easily accomplished by creating an open water column (above the zeroed transducer) of known height, using the connecting tubing that links the transducer and the fluid-filled catheter. Because the electronic display expresses pressure in mm Hg, whereas the calibrating pressure is applied in cm H2O, an appropriate conversion must be made: 1.34 cm H2O = 1 mm Hg (or 0.7 mm Hg = 1 cm H2O). A stopcock is closed to the patient, opened to atmosphere at the LA level, and lifted a known vertical distance. The electronics are then adjusted to display the pressure actually applied by the water column. This calibration can be quickly accomplished before insertion by raising the distal tip of the fluid-filled catheter (on line to the zeroed transducer) a known distance above the mid LA. Although automated electronic calibration is integral to many bedside monitors currently in use, these more basic procedures just discussed should be performed whenever utmost accuracy is required or the monitor’s output is in doubt.
As a final check that the zeroed and calibrated system is ready to record, the operator should shake the catheter tip through a substantial vertical range and observe the amplitude of the sinusoidal response on the monitor.
Dynamic Requirements
Whatever the components and linkages, a well-calibrated system measures the static vascular pressure rather accurately, unless the catheter itself becomes kinked or occluded. However, to track dynamic pressures faithfully, the liquid-filled portions of the system
must have appropriate frequency-response characteristics. These properties are the natural resonant frequency of the system and its degree of damping. Without an appropriate frequency response, the system may exaggerate or attenuate important subcomponents of complex pressure waveforms. An improperly tuned system often generates erroneous systolic and diastolic pressure values and may not allow differentiation between distorted PA and wedge pressure tracings. Moreover, partially occluded catheters connected to “continuous flush” devices can falsely elevate mean pressures as well. Air bubbles, loose or damaged fittings, inefficient coupling of disposable transducer domes to the sensing membrane, and excessively lengthy or compliant connecting tubing reduce the system’s natural resonant frequency, blunting its ability to respond. Damping is produced by air bubbles, defective stopcocks, clot or protein debris within the catheter, impingement of the catheter tip against a vessel wall, and long, narrow, or kinked catheter tubing. Prior to insertion, vertically whipping the catheter tip can give a simple, qualitative indication of frequency response. After insertion, a simple check for adequate frequency response can be conducted using the rapid flush device of the catheter system (“snap test”) (Fig. 2-4). During the rapid flush, a sustained pulse of high pressure is temporarily applied to the transducer membrane. When the flush is suddenly terminated, pressure abruptly falls. Immediately upon sudden release, the tracing from a responsive system should overshoot (plunge below) its normal baseline and briefly (<1 s) oscillate before recovering a crisp, well-defined PA waveform. A poorly tuned system fails to overshoot or oscillate and recovers to a damped configuration after a noticeable delay.
must have appropriate frequency-response characteristics. These properties are the natural resonant frequency of the system and its degree of damping. Without an appropriate frequency response, the system may exaggerate or attenuate important subcomponents of complex pressure waveforms. An improperly tuned system often generates erroneous systolic and diastolic pressure values and may not allow differentiation between distorted PA and wedge pressure tracings. Moreover, partially occluded catheters connected to “continuous flush” devices can falsely elevate mean pressures as well. Air bubbles, loose or damaged fittings, inefficient coupling of disposable transducer domes to the sensing membrane, and excessively lengthy or compliant connecting tubing reduce the system’s natural resonant frequency, blunting its ability to respond. Damping is produced by air bubbles, defective stopcocks, clot or protein debris within the catheter, impingement of the catheter tip against a vessel wall, and long, narrow, or kinked catheter tubing. Prior to insertion, vertically whipping the catheter tip can give a simple, qualitative indication of frequency response. After insertion, a simple check for adequate frequency response can be conducted using the rapid flush device of the catheter system (“snap test”) (Fig. 2-4). During the rapid flush, a sustained pulse of high pressure is temporarily applied to the transducer membrane. When the flush is suddenly terminated, pressure abruptly falls. Immediately upon sudden release, the tracing from a responsive system should overshoot (plunge below) its normal baseline and briefly (<1 s) oscillate before recovering a crisp, well-defined PA waveform. A poorly tuned system fails to overshoot or oscillate and recovers to a damped configuration after a noticeable delay.
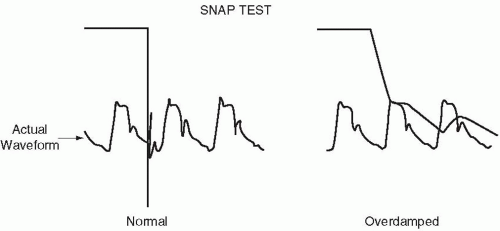 ▪ FIGURE 2-4 The rapid flush test for determining the dynamic response of a catheter transducer system. |
Accurately calibrated strip-chart or frozen screen records of pulmonary vascular pressure should be examined frequently, particularly when serious diagnostic or therapeutic questions arise. Pressures must be referenced consistently to the same point in the respiratory cycle. For the wedge pressure, this is preferably at end expiration, except during very vigorous breathing when the mean value of the wedge may better reflect average transmural pressure. Influenced by fluctuations of intrathoracic pressure, electronically processed digital displays of “systolic, diastolic, and mean” pressures may be misleading, particularly during forceful or chaotic breathing. The strip-chart and frozen calibrated screen recordings allow the clinician to adjust for the influence of ventilatory effort. The simultaneous recording of pulmonary wedge pressure (Pw), together with airway or (preferably) esophageal pressure, greatly facilitates interpretation.
Types of Pressure Measurement
Although there is an understandable tendency to concentrate on the PA and wedge pressures, the experienced clinician recognizes that RV dysfunction often contributes to hemodynamic compromise during critical illness and, therefore, carefully assesses its loading and performance characteristics as well. Indeed, with current catheter technology, preload, afterload, and contractility can be more directly and completely monitored for the RV than for the LV.
Central Venous Pressure
CVP catheters serve a wide variety of clinical purposes. Since the first clinical use of the PA catheter, many physicians have considered these lines primarily as secure and predictable routes for infusing drugs, nutrients, and volume expanders; the “triple lumen” central catheters are invaluable for this purpose.
Yet, by whatever means it is acquired, the CVP tracing should not be ignored for the hemodynamic data it provides. In the supine position, the mean CVP is virtually identical to the mean RA pressure, which reflects the status of RV preload. When considered together with RV compliance and pleural pressure, mean CVP serves to index the preload of the RV. A comparison of the central venous and wedge pressures proves helpful in diagnosing RV infarction and cor pulmonale. Furthermore, the contour of the CVP tracing can indicate tricuspid regurgitation caused by RV overload, suggest pericardial restriction and tamponade, or detect the cannon waves of AV block. The sawtooth pressure waves characteristic of atrial flutter can sometimes be detected on the CVP tracing when the surface electrocardiogram is inconclusive. In the absence of lung or heart disease, CVP serves well to indicate the degree of circulatory filling (e.g., during acute GI hemorrhage). Sudden and disproportionate elevations of CVP with respect to wedge pressure accompany pulmonary embolism with clot or air, RV infarction, or acute lung disorders (bronchospasm, aspiration, pneumothorax). CVP is a primary component of the systemic vascular resistance (SVR) calculation. Superior vena caval O2 saturation, which correlates well with (but slightly exceeds) the mixed venous value, may be very helpful in monitoring the efficacy of resuscitation from hypotension and shock. Modified fiberoptic (spectrophotometric) CVP catheters can provide this information continuously.
Yet, by whatever means it is acquired, the CVP tracing should not be ignored for the hemodynamic data it provides. In the supine position, the mean CVP is virtually identical to the mean RA pressure, which reflects the status of RV preload. When considered together with RV compliance and pleural pressure, mean CVP serves to index the preload of the RV. A comparison of the central venous and wedge pressures proves helpful in diagnosing RV infarction and cor pulmonale. Furthermore, the contour of the CVP tracing can indicate tricuspid regurgitation caused by RV overload, suggest pericardial restriction and tamponade, or detect the cannon waves of AV block. The sawtooth pressure waves characteristic of atrial flutter can sometimes be detected on the CVP tracing when the surface electrocardiogram is inconclusive. In the absence of lung or heart disease, CVP serves well to indicate the degree of circulatory filling (e.g., during acute GI hemorrhage). Sudden and disproportionate elevations of CVP with respect to wedge pressure accompany pulmonary embolism with clot or air, RV infarction, or acute lung disorders (bronchospasm, aspiration, pneumothorax). CVP is a primary component of the systemic vascular resistance (SVR) calculation. Superior vena caval O2 saturation, which correlates well with (but slightly exceeds) the mixed venous value, may be very helpful in monitoring the efficacy of resuscitation from hypotension and shock. Modified fiberoptic (spectrophotometric) CVP catheters can provide this information continuously.
Interpreted in conjunction with the wedge pressure, CVP can be used to estimate fluctuations in transmural filling pressure. Because the SVC is a flaccid structure embedded in the pleural space, fluctuations in CVP crudely reflect changes in intrapleural and pericardial pressures. It has been suggested that the CVP tracks changes in pleural pressure well enough that the transmission fraction of alveolar pressure to the pleural space can be computed under passive inflation conditions as follows:
Transmission fraction = (CVPEI − CVPEE)/(PPLAT – PEX)
where CVPEI and CVPEE are the end-inspiratory and end-expiratory values of CVP, and PPLAT and PEX are the corresponding static airway pressures recorded during occluded airway (stopped flow) maneuvers. Although the wedge pressure can theoretically be used in this way, it is a less reliable indicator of changes in pleural pressure. For example, respiratory fluctuations in Pw (and estimated transmission fraction) may be exaggerated under non-zone-III conditions (see following).
Pulmonary Artery Pressure
The RV generates the systolic PA pressure (PPA) in forcing the CO through the pulmonary vascular network against resistance. Because the difference between mean arterial and venous pressures drives the flow, PPA can be made to rise by increasing the downstream venous pressure (as in LV failure), CO, or the flow resistance (as in primary lung diseases). With its large capillary reserve, the normal pulmonary vascular bed offers little resistance to runoff. Consequently, pulmonary artery diastolic pressure (PPAD) seldom exceeds LA pressure by more than a few mm Hg, even when flow is increased. Obliteration of pulmonary vascular channels, however, increases resistance, obligating a larger gradient of pressure. Under these conditions, PPAD may substantially exceed the pressure within pulmonary veins and LA. Just as importantly, the lack of recruitable vasculature reduces the compliance reserve that normally buffers PPA against fluctuations in CO. Consequently, major variations in PPA often attend changes in output or vascular tone, making PPAD an unreliable index of LV filling in serious lung disorders. The pulmonary vascular network is designed to accept large (5- to 10-fold) variations in CO without building sufficient pressure across the delicate endothelial membrane to cause interstitial fluid accumulation and alveolar flooding. Therefore, the RV normally develops only enough power to pump against modest impedance. As a rule, the normal RV cannot sustain acute loading to mean pressures greater than 35 mm Hg without decompensation. Over long periods, however, as during a protracted course of acute respiratory distress syndrome (ARDS), the RV strengthens and PPA builds. Indeed, the height to which PPA is forced to rise may be a useful prognostic index, correlating inversely with outcome. Given adequate time to adapt to massively increased afterload, systemic levels of arterial pressure can be sustained. Once the pulmonary vascular reserve is exhausted, an additional obliteration or narrowing by embolism, hypoxia, acidosis, or infusion of vasoactive drugs may evoke a marked pulmonary pressor response. Such elevations of hydrostatic pressure may cause fluid leakage, even across precapillary and postcapillary vessels. It is certainly possible, therefore, that hydrostatic pulmonary edema can form even when LA and pulmonary venous pressures (reflected by the wedge) remain within the normal range, especially if the serum oncotic pressure is low.
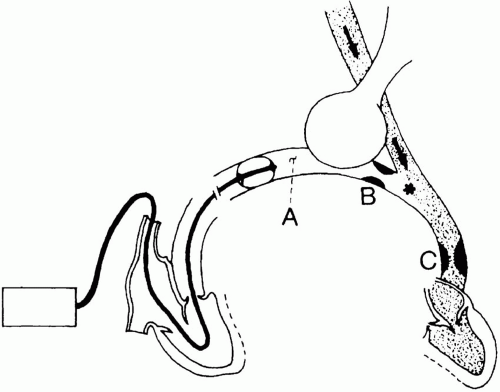 ▪ FIGURE 2-5 Definition of a wedge pressure (Pw). The Pw, measured at point A, is nearly identical to the pressure at the junction of static and flowing venous blood (*). Pw will not be influenced by partial occlusions of the static column (B) that extends from the catheter tip to the junction. However, obstructions (C) downstream from the junction point dissipate pressure, causing Pw to significantly exceed mean PLA. Although generally located in a large pulmonary vein, the junction point may reside in a small pulmonary venule in certain disease states. |
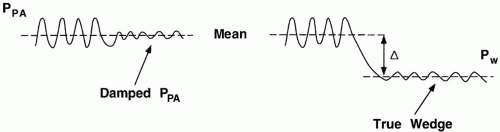 ▪ FIGURE 2-6 Distinguishing a damped PA pressure (PPA) tracing from a true wedge pressure (Pw ) during balloon inflation. The mean pressure of a damped PPA tracing should approximate that of the undamped PPA waveform recorded with the balloon deflated (left). A true wedge pressure is distinguished by a mean pressure that is substantially lower than that of the PPA (right). |
Pulmonary Arterial Occlusion (Wedge) Pressure
Balloon inflation encourages the catheter tip to migrate from a main PA into a smaller-caliber vessel, where it impacts and wedges. With the distal catheter orifice isolated from PPA, fluid motion stops along the microvascular channels served by the occluded artery (Fig. 2-5). Because no resistive pressure drop occurs along this newly created static column, the pressure at the catheter tip equilibrates with the pressure at the downstream junction (“j” point) of flowing and nonflowing venous blood. It is believed that this junction normally occurs in a vessel of a size similar to that of the occluded artery—that is, in a large vein. Pulmonary wedge pressure, therefore, provides a low-range estimate of the mean hydrostatic pressure within the more proximal fluid-exchanging vessels. When resistance in the small veins is high, Pw may not accurately reflect the true tendency for edema formation. Pulmonary capillary pressure is seriously underestimated when mean PPA substantially exceeds Pw. As a crude approximation, the pressure relevant to fluid filtration across the pulmonary vessels generally exceeds Pw by about 40% of the difference between the mean PA and wedge pressures (Fig. 2-6).
The validity of the Pw measurement rests on the assumption that the occlusion of a major vessel by the balloon does not reduce the total blood flow through the lungs. This is not always a good assumption when the pulmonary vascular reserve is limited—as after pneumonectomy. In these circumstances, balloon inflation can detrimentally afterload the RV, potentially reducing pulmonary blood flow and Pw during the measurement. Because large pulmonary veins are inherently low-resistance vessels, Pw usually deviates little from PLA. Mean PLA, in turn, closely approximates left-ventricular enddiastolic pressure (PLVED) in the absence of mitral valvular obstruction or incompetence or markedly reduced ventricular compliance. Because PLVED is the intravascular pressure component that determines preload, Pw not only provides a low-range estimate of the hydrostatic pressure in the pulmonary venous circuit but also gives some indication of presystolic LV fiber stretch when interpreted in conjunction with an estimate of extramural pleural pressure (e.g., by esophageal balloon).
Obtaining a Valid Wedge Pressure
Unfortunately, a number of technical and physiologic factors encourage errors of data acquisition as well as misinterpretation of recorded values (Table 2-2). The validity of Pw as a measure of pulmonary venous pressure depends on the existence of open vascular
channels connecting the LA with the transducer. However, microvessels exposed to interstitial and alveolar pressures separate the catheter tip from the downstream “j” point. Because these vessels are collapsible, the interrelation between alveolar gas and fluid pressures governs the patency of the vascular pathway.
channels connecting the LA with the transducer. However, microvessels exposed to interstitial and alveolar pressures separate the catheter tip from the downstream “j” point. Because these vessels are collapsible, the interrelation between alveolar gas and fluid pressures governs the patency of the vascular pathway.
TABLE 2-2 CHECKLIST FOR VERIFYING THE POSITION OF PA CATHETER | ||||||||||||||||||
|---|---|---|---|---|---|---|---|---|---|---|---|---|---|---|---|---|---|---|
|
Zoning Conceptually, the upright lung can be divided into three zones, viewing the pulmonary vascular network as a variable (Starling) resistor vulnerable to external compression by alveolar pressure (Fig. 2-7). These zones theoretically extend vertically because regional vascular pressures within the lung are affected by gravity, unlike the uniform gas pressure within the alveoli. In zone I, near the apex of the upright lung, alveolar pressure exceeds both PPA and pulmonary venous pressure, flattens alveolar capillaries, and stops the flow. In zone II, alveolar pressure is intermediate between PPA and pulmonary venous pressure, so flow in this region is determined by the arterial-alveolar pressure gradient. In zone III, near the lung base, alveolar pressure is less than either vein or artery pressure and does not influence the flow. Inflation of the catheter balloon isolates downstream alveoli from PPA. To sense pressure at the “j” point, the catheter tip must communicate with the pulmonary veins via a channel whose vascular pressure exceeds alveolar pressure. Intuitively, it would seem that only in zone III could patent vascular channels remain open to connect the catheter lumen and the LA. Outside zone III, alveolar pressure would exceed pulmonary venous pressure, collapsing the capillaries in those regions and forcing Pw to track fluctuations in alveolar pressure, rather than PLA. Although conceptually valid, it is now clear that this simple schema does not always apply. If a portion of the capillary bed in communication with the occluded catheter tip extends below the LA reference level, the hydrostatic column extending down to those vessels will raise their intraluminal pressures sufficiently to maintain a patent channel, even when the tip of the catheter lies at the level of zone II. Alveolar pressure will not collapse these lowermost vessels until it exceeds PLA plus this hydrostatic pressure (often 5 to 10 cm H2O). Moreover, zone III conditions tend to be reestablished at end exhalation, even if alveolar distension collapses the capillary bed at the higher lung volumes prevailing during the remainder of the tidal respiratory cycle. Thus, “zoning” is not usually a problem with positive end-expiratory pressure (PEEP) up to 10 cm H2O, even in patients with nearly normal lungs. This problem seldom occurs so long as the catheter tip lies at or below the level of the LA—its usual position. Furthermore, densely infiltrated or flooded alveoli may protect the patency of vascular channels, despite an unfavorable relationship between pulmonary venous pressure and the pressure within gas-filled alveoli. Shunted blood is not exposed to aerated alveoli. When a zoning artifact does arise, lateral decubitus positioning can be used to place the catheter tip in a dependent position relative to the LA, effectively converting the wedged region from zone II to zone III.
Related posts:


Stay updated, free articles. Join our Telegram channel

Full access? Get Clinical Tree


