1. Pediatric anesthesiologists have long recognized that pharmacologic and physiologic calculations are larger on a “per kg” basis for infants and children than for adults.
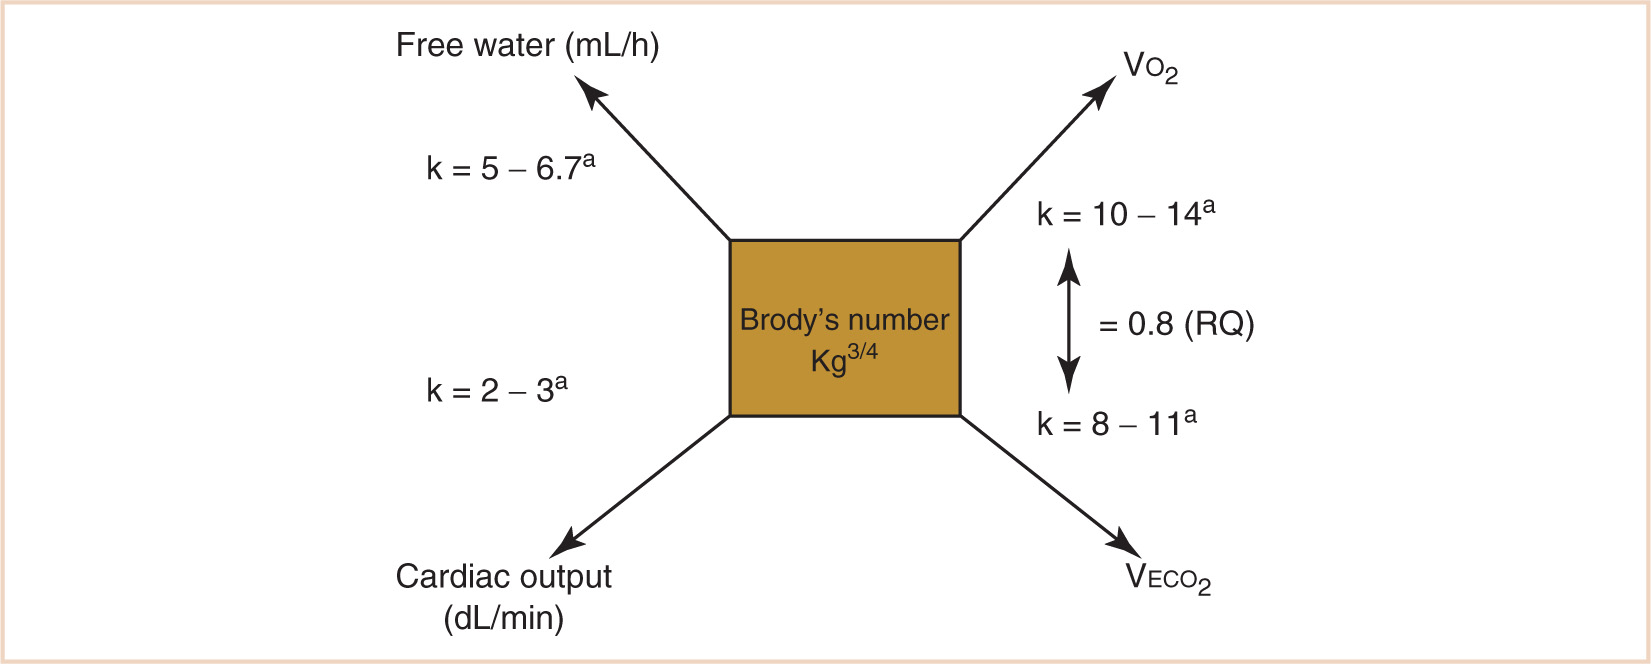
2. Using the kg3/4 calculation, metabolic oxygen consumption (VO2), CO2 production (VECO2), free water requirements, and the cardiac output can be calculated.
3. With the production of CO2 directly related to the consumption of O2 by the respiratory quotient (RQ), children also require a greater minute volume per kilogram mass than do adults.
4. Infants and small children choose a breathing strategy that increases the respiratory rate rather than the tidal volume because it is ultimately more energy efficient.
5. The cardiac output is directly related to oxygen uptake, provided the arteriovenous oxygen difference remains constant.
6. Cardiac muscle mass is smaller in newborns and infants than in older children and adults, the ventricles are less compliant, and in addition, there is a higher resting tone at end diastole with a lower peak pressure achieved during systole.
7. Baroreception, similar to myocardial performance, “matures” postnatally.
8. Preterm infants less than 34 weeks’ gestational age demonstrate decreased reabsorption of glucose, sodium, phosphate, and bicarbonate. Renal concentrating capacity is impaired, and young infants fail to concentrate their urine to levels commonly observed in older children and adults.
9. Approximately 40% of newborns will regurgitate, and this process may take several months to mature. This, however, is different from true gastroesophageal reflux.
10. N-methyl-D-aspartate (NMDA) receptors are widely distributed throughout the dorsal horn in fetal life. NMDA “windup” may be the neurochemical mechanism of neonatal pain sensitization.
11. The neonatal spinal cord is relatively free of inhibitory influences; a gradual maturing of the inhibitory system occurs in the developing infant. This lack of inhibition results in exaggerated and generalized responses.
CLINICAL PEARL Allometric scaling normalizes the essential metabolic differences between adults and children and informs almost all aspects of pediatric anesthesiology and critical care decisions.
I. Introduction. A child’s job is growth and development, a fundamental principle that the clinician must use to guide an approach to the normal and sick child. The pediatric anesthesiologist is fortunate in this regard because the biomathematics of growth and development are directly related to daily practice, in ways that are often taken for granted until explicated. This chapter will provide a basic physiologic, anatomic, and ultimately a “unifying” approach to pediatric anesthesiology. The biomathematical basis of this assertion, Galileo’s principle of similitude, was first articulated in 1638:
“The creatures of Earth must be approximately sized and shaped to the planet through the effects of gravity and chemistry, which vary as the creatures are large or small, fat or thin.” (1)
A. This brief but elegantly stated principle is the basis for allometry, the mathematics of proportional scaling. Pediatric anesthesiologists have long recognized the proportional adjustments necessary for pharmacologic and physiologic calculations—the values are larger on a “per kg” basis for infants and children than for adults. But by exactly how much, and on what basis?
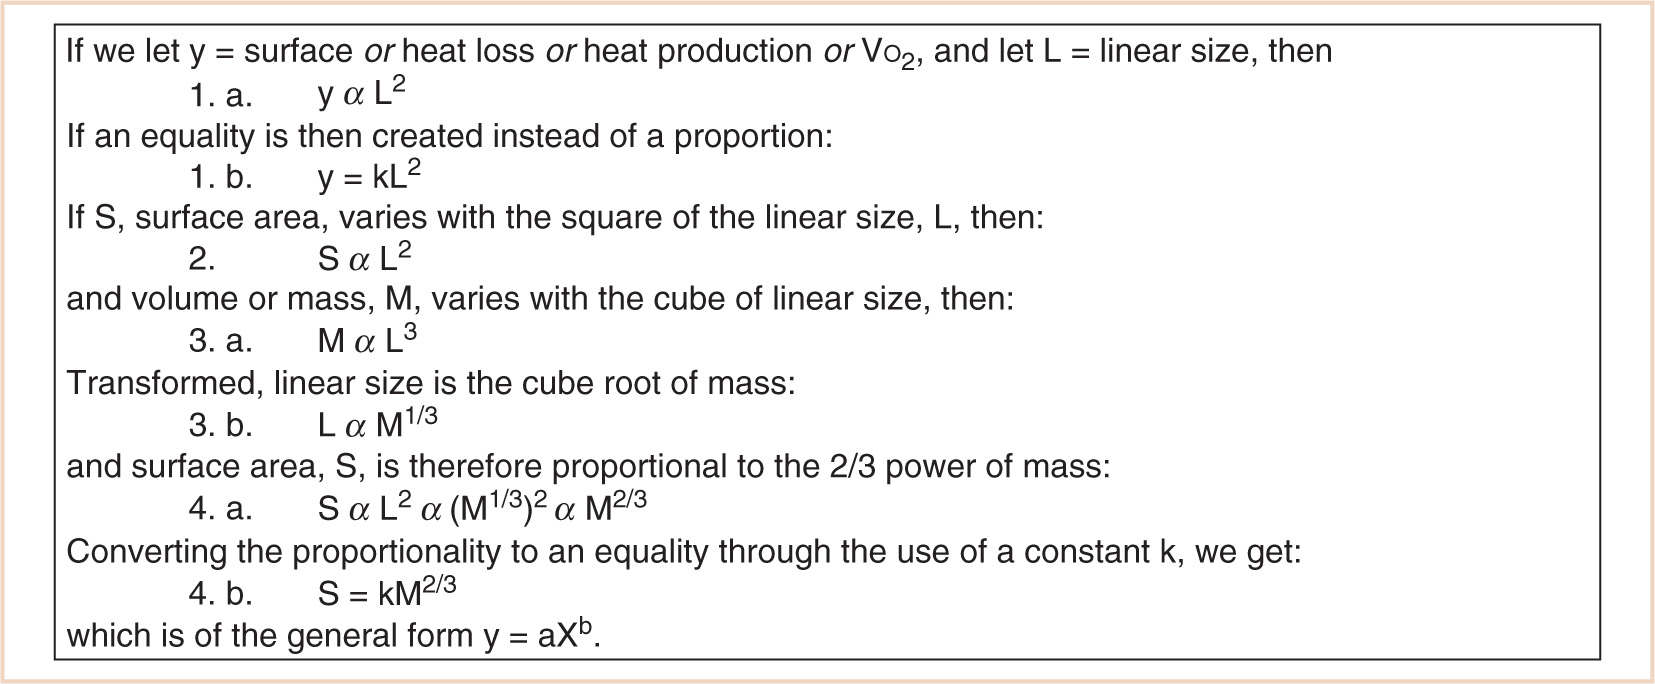
B. VO2, the most fundamental metabolic difference between children and adults, is not linearly related to body mass. Basal heat production (which needs to be in exquisite balance with basal heat dissipation in homeotherms) per unit of body mass decreases rapidly with increasing mass. For example, basal metabolism per mass unit in small animals such as mice and canaries is 20 to 25 times greater than that of large animals, such as cattle. This is the evolutionary logic of the surface law, which Rameaux and Sarrus first formulated more than 150 years ago (2). Since heat loss and heat production are proportional to free surface, and since surfaces vary with the squares of the homologous sides, VO2, heat production, and heat loss should be proportional to the corresponding dimensions of the animals. The relevant calculations are detailed in Figure 1.1.
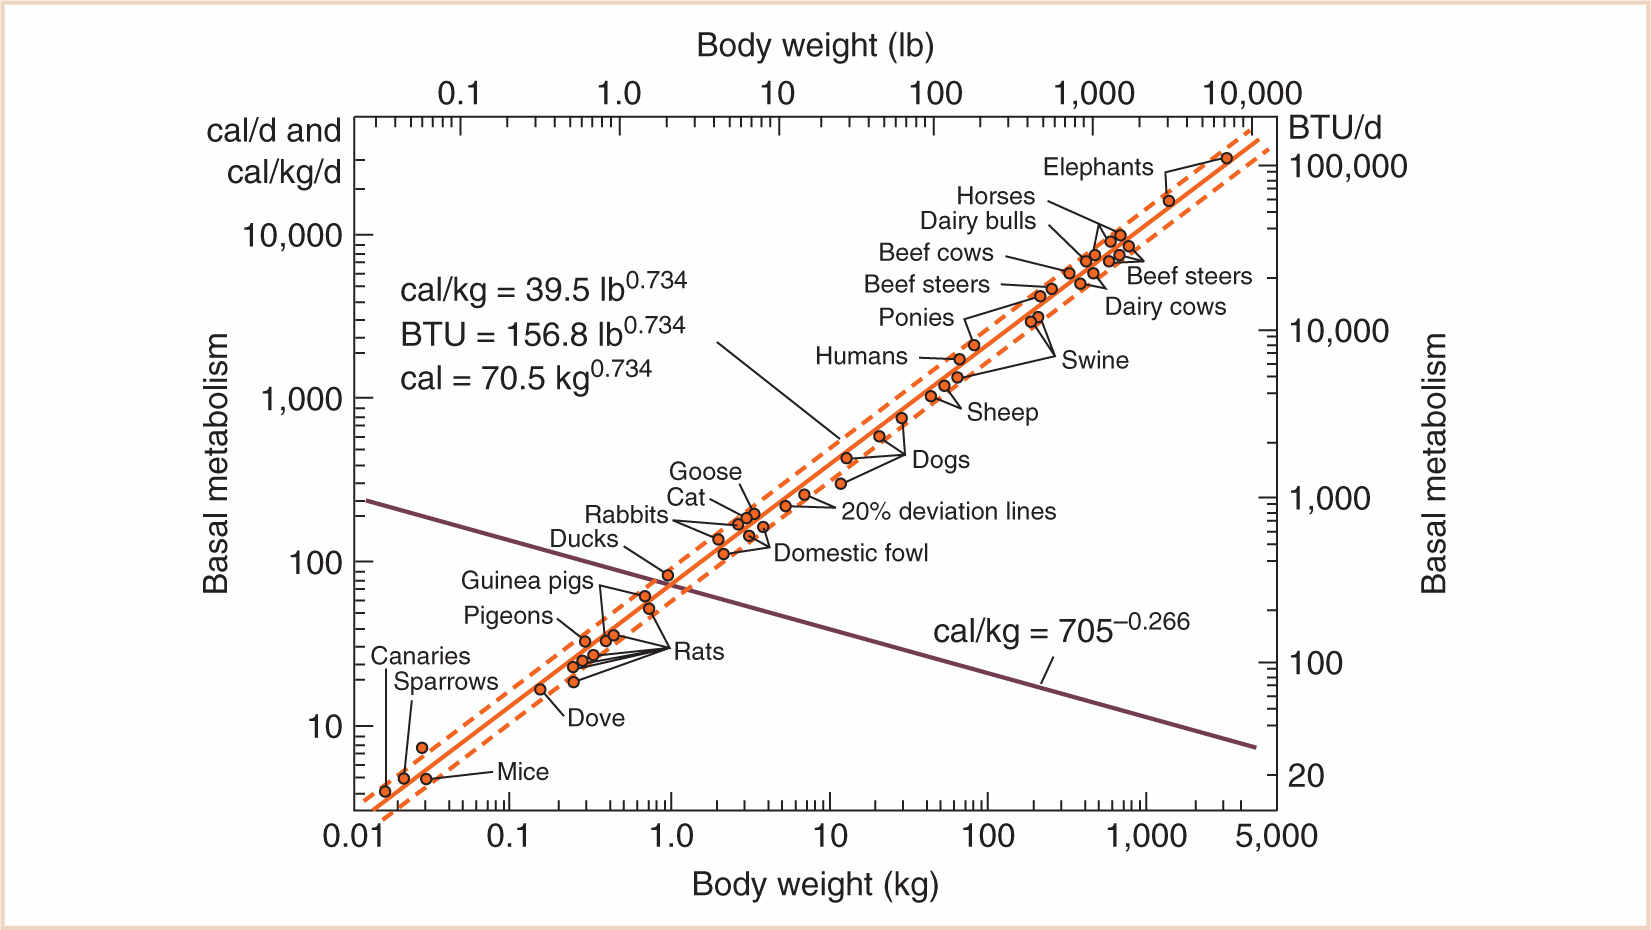
C. There are a few caveats, of course. Although it is true that surface area varies with the 2/3 power of mass (the “surface law”), this is only for geometrically similar bodies of constant specific gravity. Small and large, young and old, fat and thin animals—especially of different species—may vary geometrically and also may not be of constant specific gravity. Strictly speaking, it is an oversimplification to state that adults and children are geometrically similar, because they are not: infants have short legs, big heads, and large trunks, and the surface area formula underestimates the measured surface area in children, with a predicted surface area of less than 1.3 m2. However—and here is an interesting paradox—the surface area of animals rises more slowly than the surface law would suggest, because larger animals are stockier (Galileo, again, and the influence of gravity). Therefore, it remains an oversimplification to accept body surface area (BSA) as a reference base, and the very specific concept “2/3 power of mass” does not hold as well as the more general principle aXb, with values for a and b yet to be determined based on empirical data. For that, we have to go back to a time when this information was first obtained in animal husbandry by Brody (3), who actually measured the relationship between body mass and basal metabolism and found that the “3/4 power of mass” (known eponymously as “Brody’s number”) was a much better predictor of metabolic demand (see Fig. 1.2). His contemporary, Kleiber (4), also suggested that the 3/4 power of body mass should be utilized. Much of this was anticipated by the biomathematical work of D’Arcy Thompson (5) in the early 20th century.
D. In a similar manner, because of the branched tubular systems within our bodies required to transport heat from the core to the surface, the extracellular fluid (ECF) volume, previously thought to be related to BSA, more accurately scales to the 3/4 power as well. We can accept this notion on an intuitive basis because the volume of a cylinder (V = hπr2) is also of the general form y = aXb. For pharmacokinetic calculations dependent on the ECF, such as clearance, dosing (e.g., to ED90), and volume of distribution (Vdss), the allometric scaling model fits better than either the BSA (2/3 power model) or a “per kg” (linear) model (6).

FIGURE 1.2 Log–log plot of basal metabolism vs. body weight. Note the slope of 0.734 for the line of best fit (bold). The sum of the exponents of the rising and declining curves is 1.0.

FIGURE 1.3 Calculation of allometrically scaled physiologic variables related to metabolism. aAge-dependent; in general, the constant k is greater the younger the patient.
II. Allometric scaling
A. Overview. If we are then convinced that allometry can be applied to humans of varying mass, then how do we translate this concept to the more concrete, clinical care of patients?
1. Using the kg3/4 calculation, metabolic oxygen consumption (VO2), CO2 production (VECO2), free water requirements, and the cardiac output can be calculated by applying the appropriate scalar constant (see Fig. 1.3). Note that the scalar constant in the equation increases with a decrease in body mass in order to further correct for proportionally greater metabolic activity when applied to children. This is the result of a scaled increase in the quantity of vascular networks required for maintaining the homeothermic state in immature humans, who spend a greater proportion of their life as nonantigravity organisms. For a normothermic adult in a basal VO2 state (a reasonable goal for a stress-attenuated, well-anesthetized patient), the calculated VO2 should be approximately 10 × kg3/4 or about 242 mL per minute. Some flow compensation will be inevitable for system leaks, although in a tight anesthesia machine circuit, leaks of 20 to 30 mL per minute would be considered good. When a steady state is achieved, following tissue denitrogenation and circuit–patient equilibration, perturbations of oxygen circuit concentration will reflect an oxygen debt or surfeit. The rate of equilibration of the oxygen analyzer in reflecting this relationship will be proportional to the patient’s total lung volume in relation to the volume of the breathing circuit and anesthesia machine. The small lung volume of a pediatric patient, for example, would make a much smaller contribution to altering the measured oxygen concentration in a breathing circuit with a much larger relative volume. Nevertheless, perturbations in the patient’s oxygen needs will be reflected in increases or decreases in the oxygen concentration of the breathing circuit in response to a decrease or increase in the patient’s oxygen requirement.
2. The rate of VECO2 production will be related to the rate of VO2 by the RQ (in most circumstances, 0.8) and can aid in the calculation of minute ventilation requirements as well as provide a metric for situations when minute ventilation requirements seem excessively large or small, such as malignant hyperthermia, or “cold” septic shock.
3. Body temperature, among other factors, will influence this calculation, changing the results approximately ±7% for each Centigrade degree increase or decrease. Table 1.1 illustrates how, if Brody’s number and its clinically useful derivatives were calculated for a normothermic 70-kg adult, they would yield valuable, and practical, information to an anesthesiologist (see Table 1.1).
4. Free water requirements are also proportional to metabolic demand:
The consumption of 1,000 mL of oxygen generates 4,825 cal.
If VO2 is equal to 10 3 kg3/4 (mL/minute) in adults, then heat production per hour is:
![]()
The calories required for 1 mL of water to evaporate are 63. This plus 540 cal are required to achieve the heat of vaporization (total 603 cal/mL of water). This modifies the equation to:
![]()
which parallels basal VO2, once again (7).
CLINICAL PEARL The cardiac output is directly related to oxygen uptake, provided the arteriovenous oxygen difference remains constant.
5. Cardiac output as well as perfusion adequacy are reflected by perturbations of VO2 because cardiac output is directly related to oxygen uptake, provided the arteriovenous oxygen difference remains constant. This is the basis of the Fick principle:
![]()
For adults, VO2 (242 mL/minute for a 70-kg adult) divided by the typical CaO2 – C![]() o2 (as a reasonable approximation, assuming a hemoglobin concentration of 15 g/dL and an oxygen saturation of 99%, CaO2 = 20 mL/dL, and assuming the saturation of mixed venous blood is approximately 75%, C
o2 (as a reasonable approximation, assuming a hemoglobin concentration of 15 g/dL and an oxygen saturation of 99%, CaO2 = 20 mL/dL, and assuming the saturation of mixed venous blood is approximately 75%, C O2 = 15 mL/dL) yields a Q of approximately 50 dL per minute.
B. Allometric calculations in children. Allometric scaling normalizes the essential metabolic differences between adults and children and informs almost all aspects of pediatric anesthesiology and critical care decisions. Children have higher oxygen requirements on a mass basis than do adults (see Tables 1.2 and 1.3). With the production of CO2 directly related to the consumption of O2 by the RQ, children also require a greater minute volume per kilogram mass than do adults. In addition, free water requirements are ultimately proportional to caloric demands because water is required for the elimination of heat generated during metabolic activity and can therefore also be calculated in relation to basal metabolic demand.
To illustrate, examine the same strategy for the adult physiologic calculations shown in Table 1.1, but this time, for a 15-kg child (and note further that the constant k changes as well) (see Table 1.2). All results are larger on a per kg (arithmetic, or scalar) basis than those for an adult because children spend a greater portion of their day as nonantigravity biological systems, and therefore require proportionally more branching in their heat-transport systems.
1. Respiratory system anatomy and physiology
a. Because there is a greater minute production of carbon dioxide on a mass basis in children, an increase in minute volume is needed to maintain normocarbia. In the unanesthetized, nonsedated, and nonmechanically ventilated child, this goal can be accomplished by an increase in respiratory rate with a constant tidal volume or an increase in tidal volume with a constant respiratory rate. Why do children “choose” an increase in respiratory rate in childhood, when it seems that the energy cost would be more prohibitive?
TABLE 1.3 Allometrically scaled physiologic calculations for a 9-kg child
A quick example of fundamental anesthetic calculations based on allometry: calculate the minute ventilation, intravenous fluid requirements, and Fick-based cardiac output of a (normothermic) 9-kg 1-year-old. | ||
Body weight (kg) |
| 9.0 |
Brody’s numbera | kg3/4 | 5.2 |
VO2 (mL/min) | Brody’s number × 14 | 72.7 |
VECO2 (mL/min) | VO2 × 0.8 (RQ) | 58.2 |
Alveolar ventilation (VECO2/0.05) (mL/min) |
| 1,163.9 |
Minute ventilation (mL/min) | (Alveolar ventilation × 1.5) | 1,745.9 |
Free water per hour (mL/h) | Brody’s number × 6.7 | 34.8 |
Cardiac output (dL/min) | Brody’s number × 3 | 15.6 |
aCan be easily calculated on an inexpensive calculator as the kg mass multiplied by itself three times, then two square roots.
(1) There is an intriguing paradox in neonatal pulmonary physiology; although the percentage of lung weight per kg body weight remains remarkably constant (1.0% to 1.4%) with age, lung weight more than doubles by allometric calculations. In a breathing “system” with less compliance because of fewer conducting airways and total number of alveoli, the lung parenchyma and conducting airways should be less stable, subjecting them to a decrease in functional residual capacity (FRC) and collapse. One would think this system is set up for failure—fewer bronchoalveolar generations, fewer alveoli, increased VO2, and a shorter diaphragm. However, the lungs and chest wall do not collapse! In fact, FRC in spontaneously breathing infants remains around 40% of the total lung capacity.
(2) It is the balance between the outward stretch of the thorax and the inward recoil of the lungs that determines the FRC through a variety of mechanisms, including premature cessation of the expiratory phase (“braking”) at the laryngeal and diaphragmatic levels as well as the tonic activity of the diaphragm and intercostal muscles.
(3) Diaphragm thickness (tdi) in healthy term infants is in scale with body size such that maximal transdiaphragmatic pressure (Pdimax) remains relatively constant and independent of body weight and length. Larger infants tend to have thicker diaphragms and larger cross-sectional areas of the lower rib cage (8).
CLINICAL PEARL Infants and small children choose a breathing strategy that increases the respiratory rate rather than the tidal volume because it is ultimately more energy efficient.
(4) The intercostal muscles “fixate” the chest wall as the diaphragm pulls inward — an energy-requiring task. Within the constraints of maintaining the same tidal volume (on a mL/kg basis) as adults, and virtually the same FRC/VC as adults, the only choice to meet metabolic VO2 and VECO2 demands as well as defend the FRC is to increase the respiratory rate. If children “chose” an increase in tidal volume rather than respiratory rate, the inspiratory pressures required to reestablish larger lung volumes would result in a greater need for stabilization of the intercostal muscles, which would ultimately require further energy expenditure.
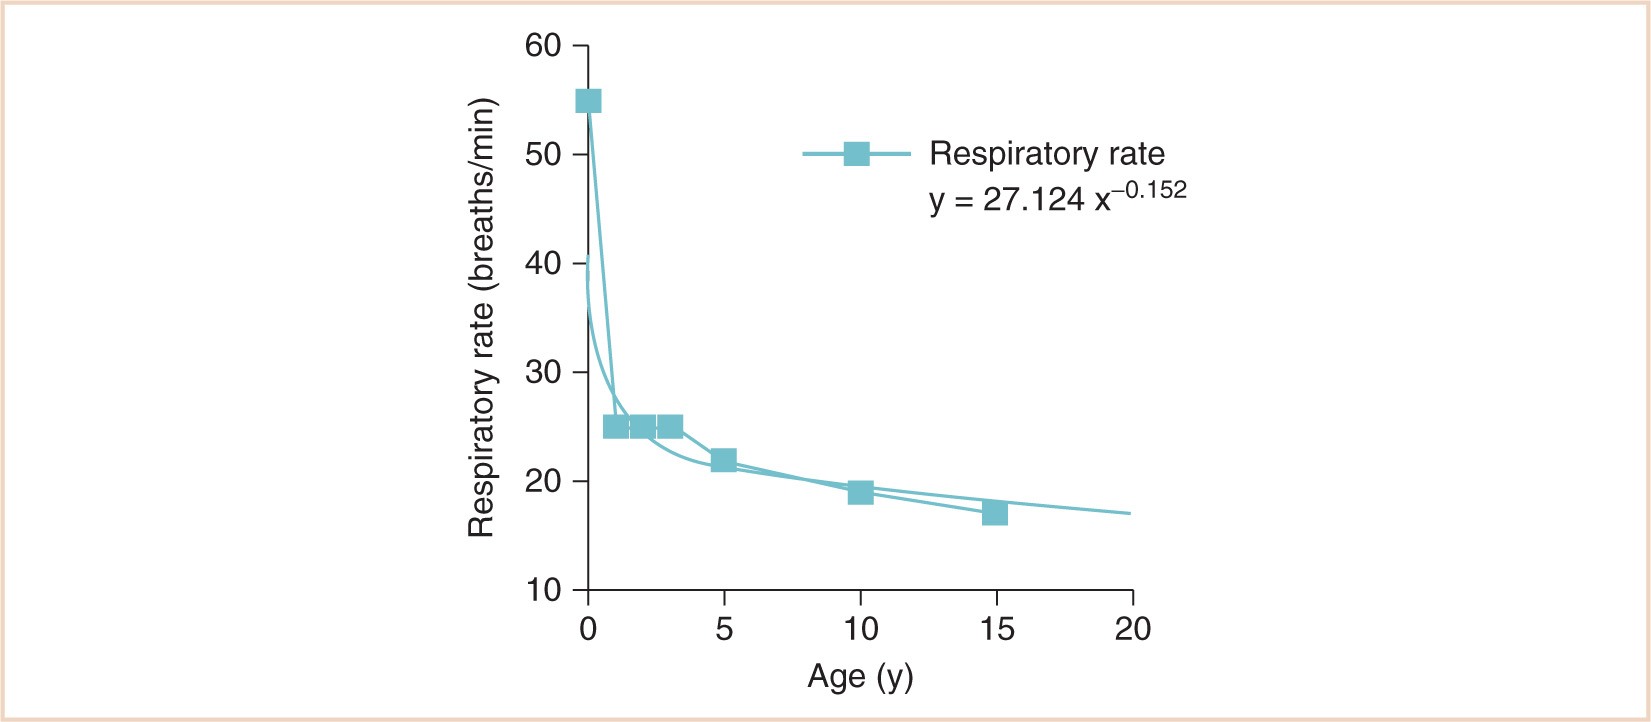
b. Therefore, infants and small children choose a breathing strategy that increases the respiratory rate rather than the tidal volume because it is ultimately more energy efficient. There is less energy consumption at a higher respiratory rate because of frequency-dependent defense of the FRC, optimal diaphragmatic contractility (a “Starling law” of the diaphragm), and minimal use of accessory muscles of respiration (minimum energy expenditure) (see Fig. 1.4) (9).
2. Cardiovascular system anatomy and physiology
a. Neonates have a cardiac output two to three times that of adults, or about 180 to 240 mL/kg/minute. The teleological argument that this high cardiac output is necessary in order to meet increased metabolic demands is, again, intuitive but not persuasive until justified allometrically. The cardiac output is, however, directly related to oxygen uptake, provided the arteriovenous oxygen difference remains constant. VO2 can be used to predict the cardiac output for a 1-month-old 4-kg infant via the Fick principle as follows:
![]()
b. If the (a −  ) DO2 is held constant (e.g., at 5 mL/dL), then oxygen uptake is indeed directly proportional to cardiac output (~3 × kg3/4 for children).
Stay updated, free articles. Join our Telegram channel

Full access? Get Clinical Tree


