Intravascular volume and hypovolemia
 Management of cerebral perfusion pressure
 Fluid management and the injured brain
 Intravenous fluid administration
 Implications for patients who have intracranial pathology
 Water and electrolyte disturbances
INTRODUCTION
Perioperative fluid management in neurosurgical patients is designed to avoid dehydration, maintain an effective circulating blood volume, preserve cerebral perfusion pressure (CPP = mean arterial pressure [MAP] – intracranial pressure [ICP]), and minimize cerebral edema. Cerebral perfusion and hemodynamic stability are essential to the maintenance of neuronal homeostasis. However, there are few useful clinical data to guide the optimal fluid choice for the prevention of secondary brain injury after a neurologic insult.
Cerebral edema, a final common pathway of numerous neurologic diseases, may rapidly become life threatening. Consequently, restrictive fluid management had been the treatment of choice in patients who had brain pathology for fear that fluid administration would exacerbate cerebral edema and raise ICP. Large volumes of crystalloid used for optimizing cerebral hemodynamics may result in fluid overload and acute cardiac failure and pulmonary edema. Fluid restriction, if pursued to the point of hypovolemia, may result in hypotension that can increase ICP and reduce CPP with devastating consequences.
I. INTRAVASCULAR VOLUME AND HYPOVOLEMIA
A. Hypovolemia and hypotension
In neurosurgical patients, and very often in the postoperative period, intravascular volume can be depleted. One of the most common causes of this is the use of diuretics. There is a substantial body of evidence to the effect that systemic hypotension, independently, can increase the morbidity and mortality in patients after traumatic brain injury (TBI). The randomized controlled trial by Clifton on therapeutic hypothermia after TBI showed that low arterial pressure (MAP < 70 mm Hg) and fluid deficit > 600 mL were associated with poor outcome.
Hypotension must therefore be avoided and rapidly corrected, but fluid should always be administered based on clinical assessment.
1. Look at the skin turgor. Is the tongue dry and furry? Is the patient peripherally shut down with cold and clammy skin and prolonged capillary refill time? Is the patient sweating and tachycardic? Usually, a persistently low urine output (< 0.5 mL/kg/hour) may be an indication of inadequate fluid replacement. This requires prompt treatment to ensure sufficient perfusion of all tissues.
2. When diuretics and mannitol are given, urinary output can be misleading, and thirst, an important early warning sign of volume depletion, cannot be evaluated if the patient is drowsy or sedated. The patient can be asymptomatic until the circulating blood volume has decreased by at least 10%. Once the intravascular volume is critically reduced, the perfusion of distal tissues becomes compromised. Hypoperfusion of the brain causes non-specific neurologic symptoms such as confusion and odd behavior.
a. Confusion is not always a consequence of the neurosurgical procedure.
b. In taking care of neurosurgical patients, think always of the brain and the intravascular volume.
c. Keep circulating volume as normal as possible and avoid iatrogenic volume depletion.
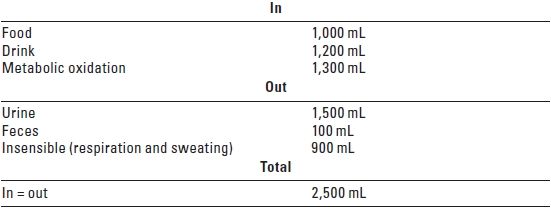
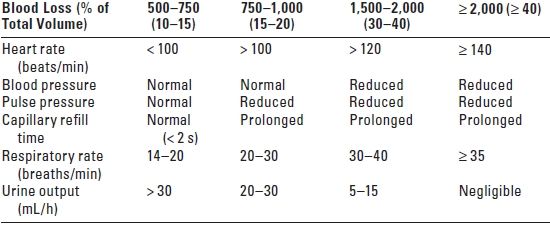
B. Basic fluid and electrolyte requirements should always be considered in the postoperative period. Table 24.1 indicates fluid input and output over 24 hours in a healthy 70 kg adult. To calculate volume replacement, the patient’s weight and the suspected blood loss (clinical estimation, see Table 24.2) are needed.
TABLE 24.1 Normal Fluid Input and Output Over 24 hours in a Healthy 70 kg Adult

TABLE 24.2 Clinical Assessment of Hypovolemia in a 70 kg Adult Patient

s, seconds; h, hour.
1. Requirements for maintenance fluid are 1.5 to 2 mL/kg/hour (2.5 to 3.5 L in 24 hours for a 70 kg adult). These are independent of the type of surgical procedure. Daily maintenance of sodium (Na) is 1 to 2 mmol/ kg/day and potassium (K), 1 mmol/kg/day.
2. For example, consider a 70-kg patient who has lost an estimated 10% of his circulating blood volume. Because 60% of body weight is water, and total water content is around 42 L (70 × 0.6), a 10% volume loss equates to 4.2 L (42 × 0.1), which needs replacement in addition to maintenance requirements.
3. In clinical practice, the formula often used to estimate the quantity of fluid needed for replacement is: Replacement = Resuscitation + Maintenance + Losses
4. A fluid challenge (an intravenous bolus of a fixed volume of crystalloid or colloid) can be used both to assess and treat volume depletion, particularly at the bedside. Monitoring the central venous pressure (CVP) during this test is often helpful for guiding further fluid administration. For example, if the CVP rises and then falls after a fluid challenge, more fluid is needed.
5. To prescribe rational fluid replacement, it is important to identify which compartment is depleted: specific losses should be replaced with the appropriate fluid.
C. Blood loss
1. If blood has been lost and crystalloid is used for replacement, the replacement volume is three times that of the estimated blood loss as only a third of that volume remains in the intravascular compartment. The replacement volume is less if colloid is administered. Table 24.3 illustrates the volume effect of different fluids that is defined as the volume of the infused replacement fluid that remains inside the vascular space.
TABLE 24.3 Intravascular Volume Effect After Infusion of Replacement Fluid

Volume effect—That amount of infused solution that remains in the intravascular compartment and increases intravascular volume.
2. If a considerable amount of blood has been lost, replacement with blood may be appropriate, depending on age, hemodynamic state, and previous illnesses, since acute anemia, both at the time of hospital admission and subsequently, is significantly associated with poorer clinical outcome. However, increased organ dysfunction and poorer patient outcome are associated with “liberal” red blood cell (RBC) transfusion strategies, while a “restrictive” transfusion strategy to maintain the hemoglobin at 7 to 9 g/dL may reduce morbidity and mortality in critically ill patients.
Blood transfusion has also been questioned in the neurosurgical population. While a higher hemoglobin level seems to be associated with improved intermediate outcome after subarachnoid hemorrhage (SAH) and TBI, RBC transfusion during or after surgery in SAH patients has been correlated with a greater risk of vasospasm as well as poorer outcome.
a. Physicians should be cautioned against using the “10/30” hemoglobin and hematocrit trigger for administering RBC transfusions in all patients, and may need to be more tolerant of normovolemic anemia.
b. Unless inadequate tissue oxygenation is part of the patient’s underlying disease, a more conservative RBC transfusion strategy may be reasonable for many patients after SAH.
II. MANAGEMENT OF CEREBRAL PERFUSION PRESSURE
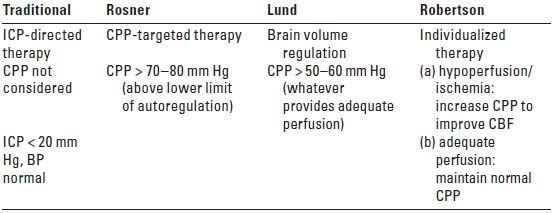
The clinical use of CPP, the difference between MAP and ICP, is based on the theoretical consideration that optimal cerebral blood flow (CBF) is necessary to meet the metabolic needs of the injured brain. When cerebral autoregulation is impaired and CPP is below the lower limit of autoregulation, CBF is dependent on CPP. Controversy exists, however, as to the optimal CPP, especially in head trauma patients. Table 24.4 summarizes the main differences among the various approaches to the management of CPP.
TABLE 24.4 Strategies for Management of Cerebral Perfusion Pressure: Therapeutic Goals

BP, blood pressure; CBF, cerebral blood flow; CPP, cerebral perfusion pressure (mean arterial pressure [MAP] − intracranial pressure [ICP]).
Modified from: Robertson C. Management of cerebral perfusion pressure after traumatic brain injury. Anesthesiology. 2001;95:1515–1517.
A. CPP-targeted therapy. The Rosner approach is based on the physiologic concept, termed the vasodilatory cascade, in which a reduction in CPP from a decrease in MAP and/or an increase in ICP stimulates the cerebral vessels to dilate in order to maintain CBF. This vasodilatation further reduces CPP by increasing cerebral blood volume (CBV) and ICP. Raising the MAP under this circumstance has been reported to break the cycle and reduce the ICP. CPP is maintained at 70 to 80 mm Hg by the use of both systemic vasopressors and fluid therapy with hyperosmolar solutions including mannitol and hypertonic saline. This approach has resulted in outcomes that were superior to an unadjusted control group from the Traumatic Coma Data Bank for which ICP management was the primary therapeutic goal. CPP-targeted therapy is now included as a treatment option in the Head Injury Guidelines.
The CPP threshold of 70 mm Hg recommended for intervention has been challenged, however, as there is evidence that elevating the CPP above this threshold by the use of vasopressors and volume expansion may not be beneficial and may actually have detrimental cerebral and systemic effects. CBF-targeted strategy aimed at maintaining the CPP > 70 mm Hg, as compared to conventional ICP-targeted strategy that keeps the CPP > 50 mm Hg, does decrease the time that CPP < 60 mm Hg and reduces the incidence of secondary cerebral ischemic events. However, this treatment strategy increased the incidence of acute respiratory distress syndrome fivefold and did not improve long-term neurologic outcome.
B. Brain volume regulation. The Lund approach advocates preserving normal colloid oncotic pressure (COP) and reducing capillary hydrostatic pressure through the use of hypotension, venodilatation, and manipulation of the plasma osmolarity. This is accomplished by the infusion of albumin and packed red blood cells and the reduction of MAP with drugs such as metoprolol and clonidine. CBV is decreased by vasoconstricting precapillary resistance vessels with low-dose thiopental or dihydroergotamine. Treatments that increase the transcapillary filtration of fluid are avoided including cerebrospinal fluid (CSF) drainage, high-dose barbiturates, osmotic diuretics, and maintenance of a high CPP. Decompressive craniectomy, which can also increase edema formation, is reserved as a last resort. Proponents of the Lund approach argue that a high CPP increases edema formation and aggravates intracranial hypertension and emphasize instead the reduction of capillary hydrostatic pressure to minimize brain edema.
C. Individualized therapy. Because of the heterogeneous nature of brain injury, individualized therapy has been advocated by Robertson as the appropriate treatment strategy, matching fluid therapy with the immediate pathophysiologic issue at hand. The pathophysiology of brain damage evolves over time so that treatment deemed appropriate in the first few hours after injury may not be necessarily optimal 2 or 3 days later. A CPP of 60 mm Hg has been shown to provide adequate perfusion for most TBI patients, and higher CPP levels should probably be reserved for those patients who demonstrate a specific indication for induced hypertension, such as regional or global ischemia.
1. The beneficial effect from the CBF-targeted management in reducing secondary ischemic insult seems to be offset by complications associated with maintaining BP at an increased level.
2. A CPP of 60 mm Hg provides adequate perfusion for most brain injured patients.
3. Higher CPP levels should probably be reserved for those patients who demonstrate a specific reason for induced hypertension such as focal or global ischemia.
III. FLUID MANAGEMENT AND THE INJURED BRAIN
Few substantial data exist in humans concerning the impact of fluids on the brain that can guide rational fluid management in neurosurgical patients. In addition, the optimal choice of fluid for prevention of secondary brain damage after neurologic insult is unknown. This lack of data makes it difficult to select a best-practice fluid regimen. Fluid selection is most likely institution specific and reflects the personal experience of the physicians. It is possible, however, to examine those factors that influence water movement into the brain and to make some reasonable recommendations.
A. Physiologic principles
1. Osmotic pressure is the hydrostatic force that acts to equalize the concentration of water on both sides of a membrane impermeable to substances dissolved in that water. Water will move along its concentration gradient until the osmolalities on both sides of the membrane equalize. Each difference of 1 milliosmole per kilogram of solvent (mOsm/kg) across a semi-permeable membrane generates an osmotic pressure of approximately 19.3 mm Hg. If two solutions of equal concentration are placed on either side of a membrane, there is no driving force.
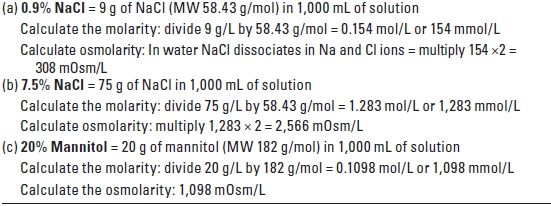
2. Osmolarity and osmolality. Osmolarity quantifies the number of particles in a solution, expressed as milliosmoles per liter of solution (mOsm/L). This value is calculated by adding the milliequivalent (mEq) concentrations of the various ions in the solution (Table 24.5). Osmolality describes the molar number of osmotically active particles per kilogram of solvent (mOsm/kg). This value is measured by determining either the freezing point or the vapor pressure of the solution. For most dilute salt solutions, the osmolality is equal to or slightly less than the osmolarity. Note that the osmotic activity of a solution demands that particles be “independent.” As NaCl dissociates into Na and Cl, two osmotically active particles are created. If electrostatic forces act to prevent dissociation of the two charged particles, then osmolality will be reduced.
TABLE 24.5 How to Calculate the Osmolarities of Crystalloid Solutions

NaCl, sodium chloride; MW, molecular weight.
3. Colloid oncotic pressure (COP) or oncotic pressure is the osmotic pressure generated by large molecules such as albumin, hydroxyethyl starch, and dextran. In biologic systems, where vascular membranes are often permeable to small ions but not to large molecules, proteins are the only osmotically active particles. Normal COP is approximately 20 mm Hg (or about 1 mOsm/L).
4. Fluid movement between capillaries and tissues
a. The major factors that control fluid movement between the intravascular and extravascular spaces are the transcapillary hydrostatic gradient, the osmotic and oncotic gradients, and the relative permeability of the capillary membranes that separate these spaces. The Starling equation describes the forces driving water across the capillary endothelium:

where FM is fluid movement, k is the filtration coefficient of the capillary wall (i.e., how leaky it is), Pc is the hydrostatic pressure in the capillaries, Pi is the hydrostatic pressure (usually negative) in the interstitial (extravascular) space, and πi and πc are interstitial and capillary oncotic–osmotic pressures, respectively.
b. Fluid movement is thus proportional to the hydrostatic pressure gradient minus the osmotic pressure gradient across a capillary wall. The magnitude of the osmotic gradient will depend on the relative permeability of the vessels to solutes. In the periphery
Stay updated, free articles. Join our Telegram channel

Full access? Get Clinical Tree


