Fig. 10.1
Micrograph of cortical neuropil stained for neurons . The cell bodies of pyramidal neurons project apical dendrites upward and parallel with adjacent pyramidal cells
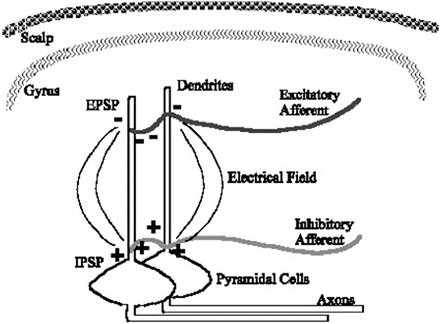
Fig. 10.2
Current flow around parallel dendrites during a period of similar afferent signals produces a larger electric field by summation
Control of Rhythm
As PSPs occur and decay, so the EEG scalp voltage changes over time. Under ordinary circumstances, millions of PSPs are asynchronously firing all over the cortex, creating in summation a complicated composite signal on the scalp. This scalp voltage cannot be decomposed back into component PSPs. As noted earlier, decades of empirical observation indicate, however, that some statistical attributes of the EEG reflect and track some underlying clues as to brain state. EEG monitoring during anesthesia relies on this statistical approach. The most useful correlation revolves around the degree of PSP synchrony in across large numbers of pyramidal cells, which determines the net magnitude and frequency on the EEG. Higher cortical functions like awareness and concentrated thought are usually associated with desynchronization, as neurons act more independently in the creation of conscious human behavior. Anesthesia and other mechanisms that depress consciousness are correlated with increasing pyramidal synchrony. Anatomically, synchrony, and indeed level of consciousness are strongly influenced by neuronal circuit loops involving cortical connection with the brainstem and thalamus [24, 25]. These circuits are sometimes called the EEG pacemakers, although their purpose is by no means clear and several different pacing rates may be present at any one time [25].
Under some conditions, the EEG may contain special stereotypic waveforms that can be used diagnostically. For example, “spikes” or “sharp waves” are sharply featured excursions in the EEG that are created by massive but usually transient synchrony. The presence of repetitive spikes is used in the diagnosis of epilepsy. Another example is burst-suppression phenomena (intermittent electrical activity interspersed with periods of little or no electrical activity), which indicates a nonspecific (e.g., trauma, drugs, hypothermia, etc.) reduction in cerebral metabolic activity.
Once generated, the aggregate postsynaptic current flows must traverse the cerebrospinal fluid (CSF), the skull, and the scalp in order to be detected by skin surface electrodes. The CSF and scalp are relatively conductive compared with the skull, and the overall effect of transmission through these multiple layers is a substantial spatial smearing of regional voltage differences. Physically, this means that the signal from an EEG electrode reflects activity over a wide area, not just the cortex directly under the electrode.
EEG Signal Acquisition
Metal needle or metal/gel electrodes are required to act as transducers, converting EEG (physiologic) ionic currents into electronic voltages, which may then be further processed by the EEG monitoring equipment. Electrodes are not perfectly faithful converters, however, and often contribute to noise and artifact. Just the physical contact between skin and metal generates a voltage potential whose amplitude is many times the size of the EEG. The now standard use of silver/silver chloride skin electrodes for EEG and ECG is an attempt to minimize artifact from electrode potentials.
Voltage signals are always measured as a difference in potential between two points; thus a bioelectric amplifier has two signal inputs, a plus and a minus. Bioelectric amplifiers also have a third input for a “reference” ground electrode, which is discussed below. Because the electrical activity of the cortex is topographically heterogeneous, it is often advantageous to measure EEG activity at several locations on the scalp. In diagnostic neurology, several systems of placement and nomenclature for electrodes have evolved; the most commonly used at present is the International 10–20 system [26]. The 10–20 system is based on meridians crossing the scalp based on key landmarks (the nasion, the inion, and the left and right aural tragus) with additional lines drawn over the midfrontal lobes and the midparietal lobes. The nomenclature uses a letter prefix designating brain site (i.e., C = central, F = frontal, P = parietal, T = temporal) and a number indicating the relative distance from the midline (nasion to inion), where right-sided electrodes are given even numbers and left-sided placement receive odd numbers. Electrodes on the midline are designated “Z,” i.e., FZ is a site overlying the falx between the frontal lobes and P3 is a left parietal site.
Diagnostic EEG as performed in the neurology clinic is seldom recorded with fewer than 16 channels (plus–minus pairs of electrodes) in order to localize abnormal activity. Monitoring 8 or 16 channels intraoperatively during carotid surgery is often recommended although there is a paucity of data demonstrating increased sensitivity for the detection of cerebral ischemia when compared with the 2- or 4-channel computerized systems more commonly available to anesthesia personnel. Although regional changes in EEG occur during changes in anesthesia dose [27, 28], there is little evidence that these topographic features are useful markers of clinically important changes in anesthetic or sedation levels [29]. EEG in the operating room is most frequently monitored from just the forehead, a hairless area allowing standard saline gel silver chloride electrodes rather than needles or cream-filled cups.
Amplifiers and Filters
The EEG signal is but one of several voltage waveforms present on the scalp. The EEG usually spans a few microvolts in amplitude and most of its energy is in a frequency range of 0.5–40 Hz. In awake subjects, there are at least three other voltage signals generated by physiologic processes in the same range of frequencies: ECG (from the R-wave vector sweeping across the neck), electromyogram (EMG, from electrical activity of scalp muscles), and the electrooculogram (EOG, generated by movement of the electrical dipoles within the eyeballs). There are still more sources of noise: mechanical motion of the electrodes on the skin creates large artifact voltages as noted above. Plus, the body acts as an antenna picking up the powerline 50- or 60-Hz signal radiated by the wiring in nearby walls and ceilings.
While these signals originating outside the brain may contain interesting information, when present, they distort and interfere with the EEG signal. An understanding of the essential characteristics of specific artifacts can be used to mitigate them. A well-designed bioelectric amplifier can remove or attenuate some of these signals as the first step in signal processing. The largest magnitude artifact is the powerline pickup. This artifact possesses two characteristics useful in reducing its impact: it is the same over the entire body surface and it is a single characteristic frequency. Because EEG voltage is measured as the potential difference between two electrodes placed on the scalp, both electrodes will have the same powerline artifact (i.e., it is a “common mode” signal). Common mode signals can be nearly eliminated in the electronics stage of an EEG machine by using a differential amplifier that has connections for three electrodes: “+,” “−,” and a reference. This type of amplifier detects two signals: the voltage between + and reference, and between − and reference, then subtracts the second signal from the first. The contribution of the reference electrode is common to both signals and thus cancels out. Removal of common mode artifacts will be perfect only if each of the + and − electrodes are attached to the skin with identical contact impedance. If the electrodes do not have equal contact impedances, the amplitude of the common mode signals on the plus and minus sides will differ and they will not cancel exactly. Most commonly, the EEG is measured (indirectly) between two points on the scalp with a reference electrode on the ear or forehead. If the reference electrode is applied far from the scalp, i.e., the thorax or leg, there is always a chance that large common mode signals like the ECG will not be ideally canceled out, leaving some degree of a contaminating artifact.
Some artifacts, like the EMG, characteristically have most of their energy in a frequency range different from that of the EEG. Hence, the amplifier can band pass filter the signal, passing the EEG and attenuating the EMG. Some EEG machines quantify and separately report EMG activity on the screen before filtering it from the EEG.
Signal Processing
Signal processing of an EEG is the massage of the voltage data by a computer to aid the recognition of some message within the EEG that correlates with the physiology and pharmacology of interest. Metaphorically, the goal is to separate this “needle” from an electrical haystack. The problem in EEG-based assessment of anesthetic state is that the characteristics of this needle are unknown, and since our fundamental knowledge of the CNS remains relatively limited, our needle-like constructs will, for the foreseeable future, be based on empirical observation. Assuming a useful quantitative EEG (QEEG) parameter is identified, it must be measured. The motivation for quantitation is threefold: to reduce the clinician’s workload in analyzing intraoperative EEG, to reduce the level of specialized training to take advantage of EEG, and finally to develop a parameter that might, in the future, be used in an automated closed-loop titration of anesthetic or sedative drugs. This section will introduce some of the mechanics and mathematics behind signal processing.
Although it is possible to perform various types of signal enhancement on analog signals, the speed, flexibility, and economy of digital circuits has produced revolutionary changes in the field of signal processing. To use digital circuits, it is, however, necessary to translate an analog signal into its digital counterpart.
Analog signals are continuous and smooth. They can be measured or displayed with any degree of precision at any moment in time. The EEG is an analog signal; the scalp voltage varies smoothly over time.
Digital signals are fundamentally different in that they represent discrete points in time and their values are quantitated to an a priori fixed resolution. The digital world of computers and digital signal processors operates on binary numbers, which are sets of quantal bits. A bit is the smallest possible chunk of information: a single ON or OFF datum. Useful binary numbers are created by aggregating between 8 and 80 bits. The accuracy or resolution (q) of binary numbers is determined by the number of bits they contain: an 8-bit binary number can represent 28 or 1 of 256 possible states, a 16-bit number 216 or 65,536 possible states. If one were using an 8-bit number to represent an analog signal, the binary number would have, at best, a resolution of approximately 0.4 % (1/256) over its range of measurement. Assuming, for example, the converter was designed to measure voltages in the range from −1.0 to +1.0 V, the step size of an 8-bit converter would be about 7.8 mV and a 16-bit converter about 30 μV. EEG monitoring systems usually use 12–16 bits of resolution. By comparison, audio CD recording are 16 bit resolution.
Digital signals are also quantized in time. When translation from analog to digital occurs, it occurs at specific points in time and strictly speaking, the value of the resultant digital signal at all other points in time is indeterminate. Translation from the analog to digital world is known as sampling, or digitizing, and in most applications is set to occur at regular intervals. The reciprocal of the sampling interval is known as the sampling rate (ƒs) and is expressed in Hertz (Hz, or samples per second). A signal that has been digitized is commonly written as a function of a sample number, i, instead of analog time, t. For example, an analog voltage signal might be written at v(t), but after digitizing would be referred to as v(i). Taken together, the set of sequential samples representing a finite block of time is referred to as an epoch. In statistical theory, the collection of all possible epochs produced from a given EEG state would be known as an ensemble.
The process of analog to digital translation inevitably leads to a loss of fidelity in the resulting digital signal. A realistic digital signal, x(i), can be thought of as the sum of a (an impossibly) perfect digital copy of the true signal xu(i) plus an error term, e(i). The quantization error, e(i), is the difference between the sampled voltage and the true analog voltage. Quantization error can be reduced by increasing the number of bits used to represent the digitized sample. The signal processing designer must trade off increased accuracy against the increased cost of higher resolution hardware (including the A-to-D) converter itself as well as a wider data path in the computing circuits (i.e., the computer arithmetic unit must be expanded to handle numbers with more bits) and more memory to hold the added bits.
When sampling is performed too infrequently, the fastest sine waves in the epoch will not be identified correctly. When this situation occurs, aliasing distorts the resulting digital data. Aliasing results from the requirement for a minimum of two points within a single cycle to identify a sinusoid. If sampling is not fast enough to place at least two sample points within a single cycle, the sampled wave will appear to be slower (longer cycle time) than the original. Aliasing is familiar to observers of the visual sampled-data system known as cinema. In a movie, where frames of a scene are captured at a rate of approximate 24 Hz, rapidly moving objects like wagon wheel spokes often appear to rotate slowly or even backward. An audio music CD is sampled at a rate of 44.1 kHz, which allows artifact-free capture up to 22 kHz, beyond the range of most adult hearing.
Therefore, it is essential to always sample at a rate more than twice the highest expected frequency in the incoming signal (Shannon’s sampling theorem [30]). Conservative design actually calls for sampling at a rate 4–10 times higher than the highest expected signal, and to also use an analog low-pass filter prior to sampling to eliminate signals that have frequency components which are higher than expected. Low-pass filtering reduces high-frequency content in a signal, just like turning down the treble control on a stereo system. In monitoring work, EEG signals have long been considered to have a maximal frequency of 30 or 40 Hz, although 70 Hz is a more realistic limit. In addition, other signals present on the scalp include powerline interference at 60 Hz and the electromyogram which, if present, will usually extend above 100 Hz. In order to prevent aliasing distortion in the EEG from these other signals, many digital EEG systems filter out signals above 30 Hz and then sample at a rate above 250 Hz (i.e., a digital sample every 4 ms).
Artifact Mitigation by Software
The problem of artifactual contamination must always be considered in EEG analysis. Artifact is particularly insidious in EEG analysis, since even to the trained observer, much of true EEG resembles noise [31]. Common artifacts include signals that have exceeded the dynamic range of the amplifier (voltage too high due to improper amplifier settings or movement of the electrodes on the skin). These artifacts are easy to recognize, but the epoch containing this artifact must be excluded from the analysis since the original data cannot be recovered. Another common type of artifact, as noted earlier, is caused by the presence of an additional signal that is outside the frequency range of the EEG. This type of signal might include electromyogram activity or powerline pickup. If the sampling rate is fast enough to avoid aliasing, these kinds of artifacts may be filtered out digitally, leaving a still-usable EEG signal. Some types of artifact including the ECG and roller pump artifact (during cardiopulmonary bypass) occur within the frequency range of interest for EEG and may be recognized by their regularity. Anesthesia equipment such as a train-of-four twitch stimulator, or an evoked potential stimulator may also create a patterned artifact in the EEG. In awake or lightly sedated subjects, eye blinks and rotation of the orbital globes create large, transient slow wave activity that may be recognized based on the pattern of signal amplitude changes. A compendium of techniques for EEG artifact detection and mitigation is provided by Barlow [32]. In commercially available EEG monitors designed for use during surgery, sampled EEG epochs with artifact may be tagged, processed, recovered, or excluded from further processing. Once the EEG signal has been digitized and cleaned up, it is ready to be analyzed to provide clinical guidance.
Time-Domain Methods
EEG is an alternating voltage composed of many wavelets (simple sine waves) superimposed on each other. Analysis of the EEG can be accomplished by examining how its voltage changes over time. This approach, known as time-domain analysis, may use either a strict statistical calculation (i.e., the mean and variance of the sampled waveform, or the median power frequency [MPF] ), or may use some ad hoc measurement based on the morphology of the waveform. Most of the commonly used time-domain methods are grounded in probabilistic analysis of “random” signals and, therefore, some background on statistical approaches to signals is useful. Of necessity, the definitions of probability functions, expected values, and correlation are given mathematically as well as descriptively. However, the reader need not feel compelled to attain a deep understanding of the equations presented here to continue on. A more detailed review of the statistical approach to signal processing may be obtained from one of the standard texts [33–35]. Only one class of ad-hoc time-domain methods, burst-suppression quantitation, is currently in use in perioperative monitoring systems and it will be described below.
A few definitions related to the statistical approach to time-related data are called for. The EEG is not a deterministic signal, which means that it is not possible to exactly predict future values of the EEG. Even if the exact future values of a signal cannot be predicted, some statistical characteristics of certain types of signals are predictable in a general sense. These roughly predictable signals are termed stochastic . The EEG is such a nondeterministic, stochastic signal because its future values can only be predicted in terms of a probability distribution of amplitudes already observed in the signal. This probability distribution, p(x), can be determined experimentally for a particular signal, x(t), by simply forming a histogram of all the observed values over a period of time. A signal such as may be obtained by rolling dice has a probability distribution that is rectangular or uniform (i.e., the likelihood of all face values of a throw are equal and in the case of a single die, p(x) = 1/6 for each possible value); a signal with a bell-shaped or normal probability distribution is termed Gaussian . As illustrated in Fig. 10.3, EEG amplitude histograms may have a nearly Gaussian distribution. The concept of statistics like the mean, standard deviation, skewness, and so on, to describe a probability distribution will be familiar to many readers.
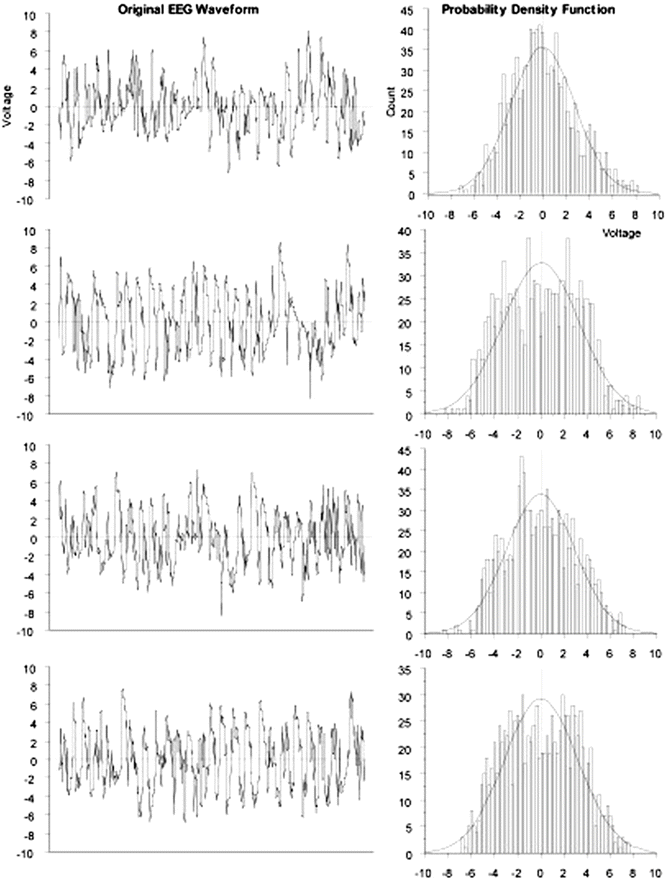
Fig. 10.3
EEG amplitude values sampled over time exhibit a normal distribution . Data recorded from anesthetized rats by author at 256 Hz with gain of 500 and analyzed as sequential 4-s epochs
If the probability function, p(x), of a stochastic signal, x(i), does not change over time, that process is stationary . The EEG is not strictly stationary as its statistical parameters may change significantly within seconds (Fig. 10.3), or it may be stable for tens of minutes (quasi-stationary) [36, 37]. If the EEG is at least quasi-stationary, then it may be reasonable to check it for the presence of rhythmicity, where rhythmicity is defined as repetition of patterns in the signal. Patterns can be identified quantitatively using correlation. Usually, correlation between two signals measures the likelihood of change in one signal leading to a consistent change in the other. In assessing the presence of rhythms, autocorrelation is used, testing the match of the original signal against different starting time points of the same signal. If rhythm is present, then at a particular offset time (equal to the interval of the rhythm), the correlation statistic increases, suggesting a repetition of the original signal voltage.
Empirically it is known that the EEG has a mean voltage of zero, over time: any sample is as likely to be positive as it is negative. However, the EEG and its derived statistical measurements seldom have a true Gaussian probability distribution. This observation complicates the task of a researcher, or of some future automated EEG alarm system that seeks to identify changes in EEG over time. Strictly speaking, non-Gaussian signals should not be compared using parametric statistical tests , such as t-tests or analysis of variance, that are appropriate for normally distributed data. Instead, there are three options: nonparametric statistical tests, a transform to convert non-Gaussian EEG data to a normal distribution, or higher order spectral statistics (see below). Transforming non-Gaussian data using its logarithm is frequently all that is required to allow analysis of the EEG as a normal distribution [38]. For example, a brain ischemia-detection system may try to identify when slow wave activity has significantly increased. A variable like “delta” power (described below), which measures slow wave activity, has a highly non-Gaussian distribution. Thus, directly comparing this activity at different times requires the nonparametric Kruskal–Wallis or Friedman’s test. However, the logarithm of delta power may produce a nearly normal p(x) curve. Therefore, the more powerful ANOVA with repeated measures test could be used appropriately to detect changes in log (delta power) over time. Log transformation is not a panacea, however, and whenever statistical comparisons of QEEG are to be made, the data should be examined to verify the assumption of normal distribution.
Clinical Applications of Time-Domain Methods
Historically, the first intraoperative application of EEG analysis used time-domain-based methods. In 1950, Falconer and Bickford noted that the electrical power in the EEG (Power = voltage × current = voltage2/resistance) was associated with changes in the rate of thiopental or ethyl ether administration. Using analog technology, they computed a power parameter as (essentially) a moving average of the square of EEG voltage and used it to control the flow of diethyl ether to a vaporizer. This system was reported to successfully control depth of anesthesia in 50 patients undergoing laparotomy [39]. Digital Total Power (TP = sum of the squared values of all the EEG samples in an epoch) was later used by several investigators, but it is known to have several problems, including its sensitivity to electrode location and to its insensitivity to important changes in frequency distribution. Arom reported that a decrease in TP may predict neurologic injury following cardiac surgery [40].
Hjorth [41] created a trio of combinations of conventional (time-domain based) descriptive statistics parameters: Activity, Mobility, and Complexity. Activity is defined as the variance of the signal amplitude within an epoch, i.e., the square of the standard deviation of the digitized data points, and provides a measure of the mean power of the signal. Mobility can be considered an approximation of the average frequency of the EEG. It is defined as the standard deviation of the first derivative of the EEG signal (i.e., the intersample slope of the waveform) divided by the standard deviation of the original signal. Complexity is a variable to quantify the degree of curve complexity beyond a baseline sine wave. These parameters of Hjorth are frequently used in the related application of sleep staging [42, 43] but have not directly been tested in perioperative monitoring.
A time-domain-based approach to analysis of the frequency information within the EEG was reported by Burch [44] and Klein [45], who estimated an “average” frequency by detecting the number of times the EEG voltage crosses the zero voltage level per second. Investigators have not reported strong clinical correlations with Zero Crossing Frequency (ZXF) . While simple to calculate in the era before inexpensive computer chips, the ZXF parameter is not simply related to frequency-domain estimates of frequency content as demonstrated in Fig. 10.4, because not all waves in the signal will cross the zero point. Demetrescu refined the zero crossing concept to produce what he termed aperiodic analysis [46]. This method simply splits the EEG into two frequency bands (0.5–7.9, 8–29.9 Hz) and the filtered waveforms from the high and low frequency bands are each separately sent to a relative minima detector. Here, a wavelet is defined as a voltage fluctuation between adjacent minima and its frequency defined as the reciprocal of the time between the waves. Wavelet amplitude is defined as difference between the intervening maxima and the average of the two minima voltages. The Lifescan Monitor (Diatek, San Diego, CA) was an implementation of aperiodic analysis; it is no longer commercially available, but its algorithms were described in detail by Gregory and Pettus [47].
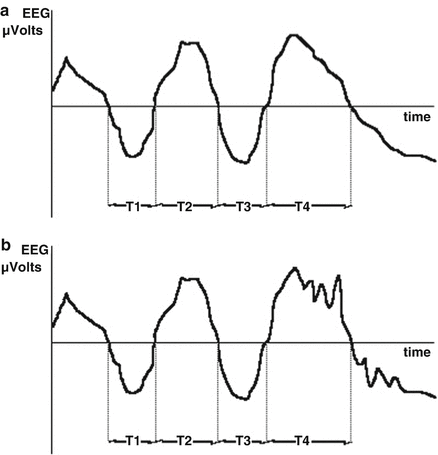
Fig. 10.4
Failure of zero-crossing algorithm to be sensitive to all components of EEG waveform. In interval T4 and beyond, the high frequency, low amplitude activity in waveform B is ignored
Burst Suppression and Its Quantitation
During deep anesthesia, the EEG may develop a peculiar pattern in the time-domain signal. This pattern, known as burst suppression , is characterized by alternating periods of normal to relatively high voltage activity changing to relatively low voltage or even isoelectricity, rendering the EEG at the usual degree of amplification inactive in appearance. Following head trauma or brain ischemia, this pattern carries a grave prognosis; however, it is nonspecific as it may also be induced by large doses of general anesthetics, in which case, burst suppression has been associated with reduced cerebral metabolic demand and possible brain “protection” from ischemia. Titration to a specific degree of burst suppression has been recommended as a surrogate endpoint against which to titrate barbiturate coma therapy. The burst-suppression ratio (BSR) is a time-domain EEG parameter developed to quantitate this phenomenon [48, 49]. To calculate this parameter, suppression is recognized as those periods longer than 0.50 s during which the EEG voltage does not exceed approximately ± 5.0 μV. The total time in a suppressed state is measured, and the BSR is reported as the fraction of the epoch length where the EEG is suppressed (Fig. 10.5).
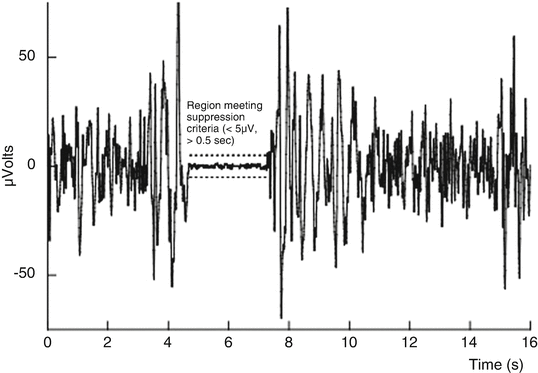
Fig. 10.5
The burst-suppression ratio (BSR) algorithm displayed graphically
The random character of the EEG dictates that extracted QEEG parameters will exhibit a moment-to-moment variation without discernible change in the patient’s state. Thus, output parameters are often smoothed by a moving average prior to display. Due to the particularly variable (nonstationary) nature of burst suppression, the BSR should be averaged over at least 15 epochs (60 s).
Frequency-Domain Methods
An important alternative approach to time-domain analysis examines signal activity as a function of frequency. Frequency-domain analysis translates waveforms that are voltage magnitudes as a function of time into spectra that are magnitudes as a function of frequency. This process of conversion is akin to the action of a glass prism, which translates white light into a rainbow spectrum (Fig. 10.6). Each color of light represents a unique frequency photon, and the relative brightness among the colors is a measure of the energy amplitude at each frequency. This type of conversion has its mathematical roots in the work of Baron Jean Baptiste Joseph Fourier who was studying heat conduction and the cyclic variations of tides. He discovered that any time-varying waveform could be decomposed into a series of pure sine waves of differing frequencies, amplitudes, and phases. For each component sine wave, frequency is the number of complete cycles per second, amplitude is one-half the peak-to-peak voltage, and phase angle is the way to describe the starting point of the waveform. However, the manual and even early computer solution of the Fourier transform for a particular set of data points was too time-consuming to be of practical use. Other approaches to frequency-domain analysis included the creation of large banks of analog filters with narrow bandpasses arrayed in parallel to emulate a true spectral analyzer [50]. It was not until Cooley and Tukey discovered a mathematical trick leading to the “fast Fourier transform” (FFT) that frequency-domain analysis became practical for real-time EEG processing [51]. The FFT algorithm results in a set of frequency bins, each containing the magnitude of the signal at that particular frequency. Although this algorithm still requires a great deal of number-crunching, current microprocessor chips can perform real-time EEG FFT analysis on up to four or more simultaneous channels. Special purpose signal processing chips can calculate FFTs with even greater speed.
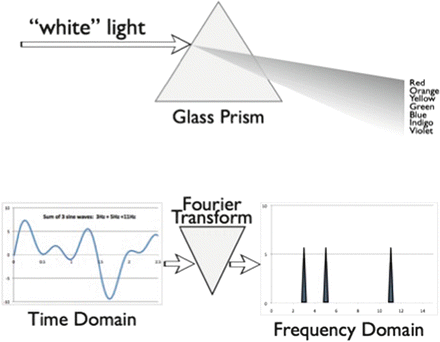
Fig. 10.6
The effect of the Fourier transform on time-varying waveform data is analogous to the effect of glass prism on light: it breaks the input up into component parts
The conversion process of a time-domain voltage waveform, x(t), into its sine wave frequency components, X(ƒ), is known as a Fourier transformation . This transformation, under ideal conditions, does not alter or reduce the information content within the waveform, and an inverse Fourier transformation will reconstitute the original waveform (i.e., the transformation is symmetric). Squaring the values of amplitude spectrum creates the power spectrum, which is the commonly used version of frequency-domain data. In typical applications, the so-called phase spectrum is discarded.
Early in his survey of human EEG, Hans Berger identified several generic EEG patterns that were loosely correlated with psychophysiologic state. These types of activity, such as the alpha rhythms seen during awake but restful periods with eyes closed, occurred within a stereotypic range of frequencies that came to be known as the alpha band. Eventually, five such distinct bands came to be widely accepted.
Using an FFT , it is a simple matter to divide the resulting power spectrum from an epoch of EEG into these band segments, then summate all power values for the individual frequencies within each band to determine the band power. Relative band power is simply band power divided by power over the entire frequency spectrum in the epoch of interest.
In the realm of anesthesia-related applications, traditional band power analysis is of limited utility, since the bands were defined for the activity of the awake or natural sleep-related EEG without regard for the altered nature of activity during anesthesia. Drug-induced EEG activity can often be observed to pass smoothly between bands as the dose changes. Familiarity with band analysis is still necessary because of the extensive literature utilizing it.
In an effort to improve the stability of band-related changes, Volgyesi introduced the augmented delta quotient (ADQ) [52]. This value is approximately the ratio of power in the band 0.5–3.0 Hz to the power in the 0.5–30.0 Hz range. This definition is an approximation because the author used analog band-pass filters with unspecified but gentle roll-off characteristics that allowed them to pass frequencies outside the specified band limits with relatively little attenuation.
John’s group [53] applied a normalizing transformation [38] to render the probability distribution of power estimates of the delta frequency range close to a normal distribution in the CIMON EEG analysis system (Cadwell Laboratories, Kennewick, WA). After recording a baseline “self-norm” period of EEG, increases in delta band power that are larger than three standard deviations from the self-norm were considered to represent an ischemic EEG change [54]. Other investigators have concluded that this indicator may be nonspecific [55].
Related posts:
 Deep Brain Stimulation
 Intraoperative Neurophysiologic Monitoring During Surgery for Supratentorial Mass Lesions
 Surgery for Chiari Type I Malformation
 Intraoperative Neurophysiological Monitoring for Intracranial Aneurysm Surgery
 Trigeminal Microvascular Decompression
 Monitoring of Jugular Venous Oxygen Saturation
Stay updated, free articles. Join our Telegram channel

Full access? Get Clinical Tree


