SCANNING TECHNIQUES
The examination will be briefly presented. Adequate texts and atlases on this topic are numerous and can be easily accessed. With recent improvements in echocardiographic technologies, and two-dimensional and color-flow Doppler echocardiography, pulsed-wave Doppler echocardiography (PW), and continuous-wave echocardiography (CW), excellent views can be obtained. For the surface examination, there are four major positions or approaches to the heart on the thorax. A discussion on the inferior vena cava (IVC) and aorta will also be made here as pathologies is illustrated later in the chapter.
| TABLE 25.2 Procedural Competency Assessment Based on Successful Interrogation of Cardiac Pathologic Conditions | |
 | |

FIGURE 25.1 Parasternal long-axis view. Ao, descending aorta, Aof, aortic outflow tract; LA, left atrium; LV, left ventricle; RV, right ventricle. (See also Video 25-1.)
Parasternal Long-Axis View
The transducer is placed in the left third, fourth, or fifth intercostal space, just lateral to the sternum. The probe marker should be directed toward the patient’s right shoulder, which will place the left ventricular (LV) cavity on the left of the screen. Angulation, rotation, and fanning of the transducer can be made until the ideal parasternal long view is obtained. The ideal view includes bisection of the mitral valve and the aortic valve, and should include the LV chamber. The apex of the LV will not be in view. Depth should be adjusted to have the pericardium and descending aorta close to the bottom of the screen (Fig. 25.1).
Parasternal Short-Axis View
After obtaining ideal view of the parasternal long axis, the transducer is rotated 90 degrees clockwise. One can use the left hand to keep the transducer steady while rotating it clockwise in order to prevent movement of the actual location. Angling or fanning the probe from the right shoulder toward the right hip, one can go through the levels of investigation of the heart: pulmonary trunk, aortic valve, mitral valve, papillary muscle, and apex levels. The papillary muscle level is most frequently used for evaluation of systolic function and LV volume (Fig. 25.2).
Apical Four-Chamber View
With the patient positioned in as much left lateral decubitus as possible, the transducer should be placed at the apex of the heart, localized at the point of maximal impulse. The probe marker should be directed toward the 3-o’clock position. In older, obese, or abdominal surgery patients, the apex will be located laterally and superiorly, with the LV more horizontal orientation. In the young, slender, or obstructive lung disease patients, the apex will be more medial and inferior, with the LV more vertical orientation. The depth also has to be increased from the parasternal view. The ideal view comprises the septum in the center of the screen and oriented vertically, with the mitral valve and tricuspid valve visualized together; RV maximal diameter is achieved through transducer rotation (Fig. 25.3).
| TABLE 25.3 Clinical Indication for the Use of Echocardiography in the ICU |
 |
| TABLE 25.4 Summary of ACC/AHA Recommendations for Physicians in Echocardiography |
 |
Subcostal (Subxiphoid) View
The transducer is placed below the xiphoid process, with the probe marker directed toward the 3-o’clock position (in cardiac presets on machine). A good amount of pressure must be placed downward with the probe almost flat on the skin (helpful to keep the palm of hand on the top portion of the probe to allow for direct contact of probe with skin). The image will be a four-chamber view, with the right side of the heart at the top of the screen, left heart at the bottom, and the apex on the right of the screen (Fig. 25.4).
Inferior Vena Cava
After proper visualization of subcostal view, with the image focused on the atrial–caval junction, the transducer is rotated counter-clockwise and slightly angled with the marker oriented toward the 12-o’clock position. The IVC can be seen in longitudinal orientation. One must recognize the relationship between the aorta and the IVC, as they can be confused if not obtained in the manner described above. Pulsatility is seen more prominent in the aorta, although in some conditions the IVC can be seen as pulsating. The relationship can be confirmed by fanning the probe toward the left of the patient and back toward the right to identify both structures before evaluations are made. Visualization of the IVC draining into the RA is specific for identification (Fig. 25.5).

FIGURE 25.2 Parasternal short-axis view. A: Labeled view. LV, left ventricle, RV, right ventricle, Sp, interventricular septum. B: Schematic depiction of the various short-axis planes that can be derived from the parasternal long-axis view. Note that the planes are not exactly parallel but provide views of anatomy from apex to base. C: Short-axis view at the level of the mitral valve (MV) is demonstrated. D: Basal short-axis projection at the level of the aortic valve.

FIGURE 25.2 E: A short-axis plane at the level of the papillary muscles (arrows) is shown. F: M-mode recording at the level of the mitral valve is shown. A B-bump is indicated by the arrows. IVS, interventricular septum; PW, posterior wall. (See also Video 25-2.) (B–F: From Feigenbaum H, Armstrong WF, Ryan T, eds. Feigenbaum’s Echocardiography. 6th ed. Philadelphia, PA: Lippincott Williams & Wilkins; 2005, with permission.)
Aorta
The patient should be in the supine position. The probe marker is toward the 3-o’clock position for obtaining transverse views of the aorta and toward the 12-o’clock position for the longitudinal views. Gentle pressure is applied in the epigastric region to push bowel gas out of the way. The aorta should be imaged from the proximal celiac trunk to the distal bifurcation. It is usually visualized as the circular vessel immediately anterior to the vertebral body. Both transverse and longitudinal planes should be measured at its maximal diameter from outside wall to outside wall. A measurement should be made near the celiac trunk and another measurement distal to the iliac bifurcation. The transverse measurement is preferred due to “cylinder” effect and underestimation of aortic size in the longitudinal measurements. Abdominal aorta size greater than 3 cm and iliac arteries size greater than 1.5 cm are an indication of abnormal size (Fig. 25.6).
DIAGNOSIS AND TREATMENT
Ventricular Performance (Systolic and Diastolic Function)
Incidence of heart failure is considerable and rising, likely due to the increasing aging population. A better understanding of the evaluation and management of these patients has been acquired over the past few years. The reported incidences for systolic heart failure in the ICU are 61% and 68%, and for diastolic heart failure 16% to 39% (44–47).
Systolic Function
Experts agree that LV systolic function determination on echocardiography is multifactorial determination, using multiple views, modes, and measurements, and ultimately is a composite decision of the interpreting physician with perspective of the potential loading conditions on the ventricle (48). In critical care bedside evaluation, some guidelines suggest that basic competence of this skill should only distinguish between hyperdynamic function, normal function, mild–moderate dysfunction, and severe dysfunction (33). However, in the authors’ opinion, knowledge of a comprehensive examination will complement the surface examination and appropriateness for further interrogation. The left ventricle function parameter, ejection fraction (EF), is load dependent (as well as fractional shortening, systolic time tissue velocity of the mitral annulus, and regional wall motion analysis [RWMA]) and is often used as an index of myocardial performance, and may be better in accuracy than pulmonary artery catheter–related parameters such as stroke volume, stroke volume index, and cardiac index (49). The strain and strain rate via echocardiography has been gaining favor as a useful parameter to evaluate load independently from indices of cardiac performance (50). The physician’s capability to construct and interpret pressure/volume loops for the determination of contractility is a controversial issue, particularly in the setting of septic shock. How to intervene in the ventricular performance or optimization? What is preload? What are the goals of resuscitation and their end points? These are all reasonable questions, and show why echocardiography should be a part of the standard management of these critically ill patients and further investigations are needed to elucidate its efficacy and accuracy in the elusive patients (51–56). Even though left ventricular ejection fraction (LVEF) is a limited myocardial performance index, it is a strong predictor of clinical outcome in most cardiac abnormalities (57–59). Of interest, EF is more reliable as a general predictor of mortality, second only to age, than when used to quantify the extent of coronary artery disease or degree of perfusion defects (60,61). Surface approach echocardiography by the use of the modified Simpson rule is superior to estimating either intracardiac volume or LVEF (62,63). In fact, TEE in this situation underestimates volume by foreshortening the LV view with less incorporation of the apex. Volumetric measurements should be objectively quantified:

FIGURE 25.3 Apical view. A: The apical four-chamber view is shown. LA, left atrium; LV, left ventricle; RA, right atrium; RV, right ventricle, MV, mitral valve, TV, tricuspid valve. B: Starting from the four chamber, the transducer can be tilted to a shallower angle to produce a plane that includes the left ventricle outflow tract and proximal aorta (Ao). C: An apical two-chamber view is demonstrated.

FIGURE 25.3 D: The special long-axis view is similar to the parasternal long-axis view but is recorded from lower interspace. E: From the apical four-chamber view, pulsed Doppler imaging can often be used to record pulmonary venous flow by positioning the sample volume at the junction of the pulmonary vein and left atrium. In this example, pulmonary venous flow has three phases: a systolic phase (PVs), a diastolic phase (PVd), and a small wave of flow reversal during atrial systole (PVa). F: The suprasternal notch also permits the aortic arch (AA) to be recorded in cross section. The plane allows visualization of the superior vena cava and demonstrates the right pulmonary artery (RPA) coursing below the arch and above the left atrium. G: The apical four-chamber view is sometimes recorded with this orientation that places just the right heart on the right. (See also Video 25-3.) (B–G: From Feigenbaum H, Armstrong WF, Ryan T, eds. Feigenbaum’s Echocardiography. 6th ed. Philadelphia, PA: Lippincott Williams & Wilkins; 2005, with permission.)

FIGURE 25.4 Subcostal view. Labeled view. LA, left atrium; LV, left ventricle; RA, right atrium; RV, right ventricle. (See also Video 25-4.)

FIGURE 25.5 The inferior vena cava (IVC). RA, right atrium.
LVEF = (LVEDV – LVESV)/LVEDV
where LVEDV refers to left ventricular end-diastolic volume and LVESV to left ventricular end-systolic volume. LVEF may also be calculated from LV dimensions measured with M-mode echocardiography at the mid-ventricular level (64,65). Three-dimensional echocardiography is currently the best practice technique for estimating volumes and EF with greater accuracy by minimizing the inherent problems of not being able to always obtain orthogonal foreshortened, short axis, and four-chamber views. Excellent comparative investigations with magnetic resonance imaging (MRI) and computed tomography (CT) with echocardiography reveal its accuracy as far as quantitative determinations (66,67).
The Doppler echocardiographic measure of systolic function is now a standard methodology in the interrogation of systolic function (68,69); acceleration (dV/dT) is easily measured by using spectral Doppler from the determination of peak outflow velocity and the time to achieve this determination. The first derivative of aortic velocity is the peak acceleration, and the slope from its onset to peak is the mean acceleration (70,71). Stroke volume is directly correlated with this velocity. By using the continuity equation, the determination of velocity of blood leaving a known chamber in relation to the cross-sectional area (CSA) of the orifice that the blood is flowing through, stroke volume can be calculated:

FIGURE 25.6 Aorta. A: Short-axis view, showing spine and spine shadow. B: Long-axis view, obtained by rotating the probe 90 degrees after acquiring the short-axis view.
Stroke volume = TVI × CSA
where TVI is the velocity–time integral on spectral Doppler (72). By multiplying by the heart rate, cardiac output is calculated. Diastolic volume and EF are determined using this same principle through the mitral valve:
EF = (stroke volume/diastolic volume) × 100.
There are significant limitations to the methods described that include a rhythm other than sinus, and the accurate determination of the dimension of the orifice through which the blood flows is transverse (73).
Tissue Doppler imaging (TDI spectral analysis), by avoiding the limitations of the above techniques has gained acceptance (Fig. 25.7) (74).
TDI is also used in the evaluation of diastolic function and preload (75,76). Normal values of Doppler velocities (S) can be determined both in the pediatric and adult population (77,78). Ventricular length and afterload (a minor contributor) will affect this value (79,80); the lower the S-wave velocity, the more depressed the myocardial function will be, even at the point prior to the visualization of thickening of the left ventricle (81). In the context of existing diastolic function, the S-wave velocities will change in relation to worsening LV systolic function (82). A poor prognostic indicator of cardiac events in patients with heart failure is when the S velocities are greater than 5 cm/s (83). For example, TDI is a useful indicator that correlates with biopsies as well as regional segment abnormalities in heart transplant recipients who experience rejection, although difficulties do arise because of tethering (84–86).
Strain and strain rate analysis is becoming of greater use in echocardiography for evaluation of myocardial performance. In addition, TEE may not be readily available in the ICU (87). This technique measures the deformity of the LV segment during the cardiac cycle, with strain referring to relative change (%) and strain rate being the absolute of change (Fig. 25.8) (88).

FIGURE 25.7 Normal spectral tissue Doppler. (From Dittoe N, Stulz D, Schwartz BP, et al. Quantitative left ventricular systolic function: from chamber to myocardium. Crit Care Med. 2007;35(8):S330–S339, with permission.)
Both strain and strain rate are being used in heart failure patients (resynchronization) for the early detection of myocardial ischemia and identification of viable myocardium (89–91). Technical limitations of this technique include a low signal-to-noise ratio, angle dependence, and a processing power that requires significant data storage and analysis (92). Nevertheless, it is independent of heart rate and afterload, although it is still influenced by preload due to the reliance on the initial diastolic dimension (93,94). Other potential advantages are the use of spectral tracking (which eliminates the angle effect), a feature that has been available only recently (95,96), and the backscatter/tissue characterization, which is similar to MRI in the evaluation of the myocardium (97–99).
Peak + dP/dT (typically recorded prior to opening of the aortic valve) is also commonly used, although some investigators believe it to be load independent in the presence of mitral regurgitation. It does have some prognostic importance (when less than 600 mmHg/s) in congestive heart failure (CHF) and valvular surgery (100,101). Other investigators believe that this index is influenced by preload and that stress-corrected, fiber-shortening velocity (Vcf) is a more viable index of CHF (102–104).
Lastly, the pseudonormalized Doppler total ejection isovolumic index (TEI) is a valid, load-independent measure of ventricular performance:
Index = (ICT + IRT)/ET
where ICT is the isovolumetric time, ET is the ejection time, and IRT is the isovolumetric relaxation time (105,106). As ventricular function worsens (diastolic or systolic), this index increases (Fig. 25.9) (107).
Measuring systolic movement of the mitral annulus ring using M mode in the apical four-chamber view, mitral annulus postsystolic excursion (MAPSE) is another method of determining LVEF. Technical pitfalls are involved, due to the proper alignment of the M mode perpendicular to the annulus movement in order not to underestimate the systolic excursions. Intra- and interobserver variability is around 5% and is an independent predictor of 28-day mortality (108,109). MAPSE greater than 10 mm correlates with an EF greater than 55%, MAPSE less than 8 mm corresponds to a reduced EF, with 8 to 10 mm being and indeterminate zone regarding LV function.
Speckle tracking echocardiography (STE) is a novel and sensitive method for assessing myocardial deformation (strain). It can unmask dysfunction before it can be detected with conventional echocardiography. Unlike Doppler imaging, STE is an angle-independent process. It can be used in sepsis in the ICU, and can identify right ventricle and left ventricle dysfunction (110). STE may help identify higher-risk patients in the ICU and standardization of this technique is under current review (Fig. 25.10) (111).
Diastolic Function
Diastolic dysfunction is greatly underappreciated in the ICU (112,113). Research and clinical endeavors have emphasized systolic function. Since the addition of PW and CW Doppler echocardiography, the importance of diastolic dysfunction came to the forefront, especially when dealing with critically ill patients in whom clinical findings and hemodynamics can often be confusing and misleading. Diastolic dysfunction may be isolated but is usually associated with systolic dysfunction (112,114,115). Ventricular interactions may be a contributing influence in the presentation of echocardiographic findings.

FIGURE 25.8 Recording of strain rate, which represents the rate of deformation; the peak negative strain rate (arrow) was −1.3 s−1. (From Oh JK, Seward JB, Tajik AJ. The Echo Manual. 3rd ed. Philadelphia, PA: Lippincott Williams & Wilkins; 2006, used with permission of Mayo Foundation for Medical Education and Research.)
Even though echocardiography provides a unique insight in LV dysfunction, there are significant difficulties with its use that must be appreciated (113). Diastole is associated with summation of the processes by which the heart loses its ability to generate force and shorten while returning to the precontractile state. Diastolic function is associated with relaxation and early ventricular filling or altered LV pressure/volume and stress–strain relationships. Many confounding factors interplay in early LV filling and compliance that, at times, may be diametrically opposed (Table 25.5) (116). Altered hemodynamics and loading conditions, as well as tachycardia, are confounding issues in accurately determining the extent of LV diastolic dysfunction, particularly in patients who experience shock states—especially distributive events (sepsis, septic shock, systemic inflammatory response syndrome [SIRS], liver insufficiency); inflammatory mediators and cytokines affect all aspects of myocardial performance including atrial dysfunction and volume (116). Tachycardia can be an early deterrent in the accurate measurement of diastolic function (117).
| TABLE 25.5 Factors Influencing the Left Ventricular End-Diastolic Pressure–Volume Relation (Chamber Stiffness) |
 |

FIGURE 25.9 Ventricular remodeling in systolic and diastolic heart failure. Left: Autopsy examples. Right: Cross-sectional two-dimensional echocardiographic views of systolic and diastolic heart failures compared with normal are illustrated. In systolic heart failure, the left ventricular cavity is markedly dilated and wall thickness is not increased. In diastolic heart failure, the cavity size is normal or decreased and wall thickness is markedly increased. (Reprinted from Konstam MA. Systolic and diastolic dysfunction in heart failure? Time for a new paradigm. J Card Fail. 2003;9:1–3, with permission.)
Doppler indices can appreciate the complexities of LV relaxation. The rate of LV relaxation is estimated from the maximal rate of pressure decay (−dP/dtmax) and other indices (such as the relaxation half-time [RT]) (118). Tau (isovolumetric relaxation) reflects the aortic valve closure to mitral valve opening and appears to be a better index of relaxation because of the decreased load dependency (119).
Although the pressure/volume relationship of the left ventricle is more often emphasized, the pressure/volume relationship of the atria can also play an important role. Other extrinsic factors and myocardial ischemia may contribute to impairment of diastolic dysfunction. Despite the limitations discussed, echocardiography remains a viable tool for detecting the presence of diastolic dysfunction (112,113). Left atrium enlargement is the consequence of longstanding left atrium pressure and/or volume overload. Left atrium volume is sometimes called the HbA1c of study of diastolic dysfunction. Left atrium dilation is considered incompatible with preserved diastolic dysfunction. Quantification of left atrium volume according to body surface area (LAvol/BSA) is as follows (120–122):
- LAvol/BSA < 29 mL/m2: normal
- LAvol/BSA: 29−33 mL/m2: mild
- LAvol/BSA: 33−39 mL/m2: moderate
- LAvol/BSA > 39 mL/m2: severe
The morphologic and functional differences between diastolic and systolic heart dysfunction are described in Table 25.6.
Diseases germane to the critically ill—such as metabolic derangements involving mitochondrial dysfunction as seen in sepsis, SIRS, and liver insufficiency—or simply the postcardiac surgical patient status can affect the passive/active relaxation of the left ventricle (116,123–128). Comorbid conditions (hypertensive heart disease) and the presenting hemodynamic picture (the level of the atrial pressure and its rate of development) will also influence this relationship. Diastolic chamber stiffness is dependent on ventricular chamber characteristics (mass, volume) and myocardial stiffness, both load size- and chamber size–independent variables of passive chamber and myocardial properties (112,129,130).
| TABLE 25.6 Morphologic and Functional Changes in Diastolic vs. Systolic Heart Failure | ||
 | ||
The echocardiographic assessment is accomplished through several means: M-mode and two-dimensional echocardiography and Doppler techniques. LV diastolic pressure, diastolic function, and ventricular and atrial filling patterns are measured by flows through the pulmonary veins (left atrial [LA] filling) and annular velocities through the mitral valve orifice (LV filling) (112,131). By measuring these parameters, one can get a sense of prognosis and outcomes in patients with heart failure that can guide treatment (132). In addition, by using these Doppler techniques for measuring pulmonary artery pressures, the clinician can predict the extent of hospitalization and mortality (133). There are several patterns seen via PW Doppler through the mitral valve, which reflects the relationship between the LA and LV diastolic pressures. Normally, regarding the early/late filling pattern and ratio, E/A is greater than one. The deceleration time of E velocity (DT) and isovolumic relaxation time (IVRT) are other parameters obtained in the interrogation of this flow. Other patterns easily detected are restriction (E/A less than 2), pseudonormalization (E/A 1–1.5), and abnormal relaxation (E/A less than 1) (Table 25.7) (108). To clarify the second pattern, tissue Doppler index (TDI Ea [early annular] velocity) is measured through the mitral annulus. This technique measures high amplitude and low velocity of the myocardium (134). It appears that early diastolic annular velocity Ea is relatively load independent and should be completed in every patient (135). Ea will decrease in the presence of elevated filling pressures associated with increases in early diastolic transmitral velocity. Of interest, the transmitral early diastolic velocity/tissue Doppler early diastolic annular velocity E/Ea correlates with pulmonary artery occlusion pressure and mean diastolic LV pressure over an extended range of EF (122,136–138).
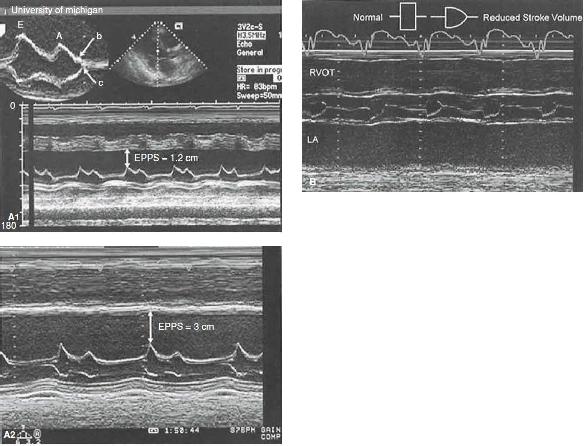
FIGURE 25.10 Left ventricular function. A: M-mode echocardiograms recorded in two patients with significant systolic dysfunction. Top: An E-point septal separation (EPSS) of 1.2 cm (normal M6 mm). Bottom: Recording in a patient with more significant left ventricular systolic dysfunction in which the EPSS is 3.0 cm. Also, note the interrupted closure of the mitral valve with a B bump (top), indicating an increase in the left ventricular end-diastolic pressure. B: M-mode echocardiogram recorded through the aortic valve in a patient with reduced cardiac function and decreased forward stroke volume. Note the rounded closure of the aortic valve, indicating decreasing forward flow at the end of systole. Normal and abnormal aortic valve opening patterns are noted in a schematic superimposed on the figure.

FIGURE 25.10 C: Diagram of cardiac structures from standard tomographic planes: parasternal long-axis view (left), parasternal short-axis view (upper right), and apical four-chamber view (lower right). D: From the esophagus, the probe can be flexed to yield a basal short-axis projection. LA, left atrium; RA, right atrium; RV, right ventricle; RVOT, right ventricular outflow tract.

FIGURE 25.10 E: Schematic representation of two-dimensionally derived measurements of left ventricular systolic function. Top: The methodology for determining fractional area change, which is defined by the formula in the figure. Middle and bottom: Using the geometric assumption that the left ventricular cavity represents a cylinder and cone configuration, the volume of each separate component can be calculated as noted. The overall left ventricular volume equals the sum of the two volumes. See text for further details. F: Schematic representation of a simplified method for determining the left ventricular ejection fraction from three separate minor-axis dimensions at the base, mid, and distal portions of the left ventricle in an apical view. The contribution of the apex is expressed as a constant (Kapex) ranging from −5% to +15%.

FIGURE 25.10 G: The left ventricular volume cast (lower right) was created from 3D echocardiography imaging. Regional left ventricular volume changes are shown in the plot at the bottom. The color of each line corresponds to the segment of the same color in the left ventricular cast. (See also Video 25-5.) (A,B,D–F: From Feigenbaum H, Armstrong WF, Ryan T, eds. Feigenbaum’s Echocardiography. 6th ed. Philadelphia, PA: Lippincott Williams & Wilkins; 2005, with permission. G: From Oh JK, Seward JB, Tajik AJ. The Echo Manual. 3rd ed. Philadelphia, PA: Lippincott Williams & Wilkins; 2006, used with permission of Mayo Foundation for Medical Education and Research.)
| TABLE 25.7 Classification of Left Ventricular Filling Patterns |
 |
Interrogation of the pulmonary venous patterns (PVF) is helpful in depicting diastolic dysfunction. Both modes of echocardiography (TTE and TEE) are useful, but invariably, TEE can only assess the flow characteristics usually in the left upper superior vein. The pattern seen is related to the suction effects of the LV and the LA. The systolic component represents LA filling during atrial relaxation (S1) and ventricular contraction (S2). The diastolic forward phase reflects the opening of the mitral valve. Atrial reversal flow represents retrograde flow during atrial contraction (less than 20 cm/s). The extent of reversal of atrial flow may also reflect elevated LA pressure with or without LV compliance changes (112).
Color M-mode Doppler is another method for identifying diastolic function abnormalities and is believed to be load independent (139). Thus, the propagation velocity (Vp) is inversely related to the time constant of LV relaxation (140). This method can be used with the E velocities and the IVRT to estimate pulmonary occlusion pressure (141). It is of interest that Vp may distinguish between restrictive and constrictive pericardial cardiomyopathies (139).
M-mode and two-dimensional echocardiography are underappreciated in diastolic function assessment. The timing and extent of LV thinning rate and wall motion as well as the duration of atrial contraction and early relaxation can provide useful data. Filling dynamics can be obtained by measuring, frame by frame, the LV volume with either apical four-chamber or short-axis views (142,143). Assessing ventricular volume and mass with M-mode echocardiography provides information of the ventricular pressure/volume relationship relating to operative chamber compliance. Also, a marker for duration and severity of diastolic dysfunction is LA volume (144).
TDI is an echocardiographic technique that directly measures myocardial velocities. Diastolic tissue Doppler velocities reflect myocardial relaxation and, in combination with conventional Doppler measurements, ratios (transmitral early diastolic velocity/mitral annular early diastolic velocity [E/Ea]). Ea is a relatively preload-independent measure of myocardial relaxation in patients with cardiac disease as compared to early transmitral velocity, and has been developed to noninvasively estimate LV filling pressure. Consequently, mitral E/Ea can help to establish the presence of clinical CHF in patients with dyspnea. However, E/Ea has a significant gray zone and is not well validated in a nonsinus rhythm and mitral valve disease. B-type natriuretic peptide (BNP) is a protein released by the ventricles in the presence of myocytic stretch and has been correlated to LV filling pressure and, independently, to other cardiac morphologic abnormalities. In addition, BNP is significantly affected by age, sex, renal function, and obesity. Given its correlation with multiple cardiac variables, BNP has high sensitivity, but low specificity, for the detection of elevated LV filling pressures. Taking into account the respective strengths and limitations of BNP and mitral E/Ea, algorithms combining them can be used to more accurately estimate LV filling pressures in patients presenting with dyspnea (145).
| TABLE 25.8 Echocardiographic Left Ventricular Morphologic and Functional Characteristics in Primary Systolic and Diastolic Heart Failure Compared with Controls | |||
 | |||
In summary, systolic and diastolic dysfunction are two definitive entities or syndromes of heart failure. Even though the clinical symptoms and hemodynamic presentations may appear similar, the primary function and myocardial structural derangements are quite distinctive. There are marked advancements for treatment of systolic heart failure, but treatment for diastolic failure is still empiric. Echocardiography can serially follow and evaluate the treatment management of these patients (113), and in so doing, prognostic indicators can be detected (133,146). Therefore, the use of echocardiography in the syndromes of heart failure is crucial for enhancement of patient care and outcome. Even in sepsis, bedside evaluation of the ventricular function with echocardiography is a proven imaging tool (147). Left ventricular morphologic and functional characteristics in primary systolic and diastolic heart failure compared with controls are represented in Table 25.8.
Right Ventricular Assessment: Pulmonary Embolism and Right Ventricular Infarction
Findings of right heart failure in acute pulmonary embolism (PE) have higher mortality and morbidity (148). Chest CT or other modalities may not be feasible in certain critically ill patients (renal failure, unstable hypoxia, or hemodynamic instability). In these instances, a focused cardiac examination may help by ruling out other forms of shock, and may present with right heart strain and/or dilation. It has been suggested that echocardiography can be used to justify thrombolytics in certain patients who cannot get definitive diagnoses (149), but this suggestion has been questioned unless direct visualization of the proximal PE (150,151). TEE can diagnose large, central PEs with rare false positive results (152,153). This catastrophic cardiovascular event can either be underdiagnosed or overdiagnosed (154–159). A low cardiac output and RV failure post PE presages mortality because of the extent of distal obstruction. Early identification of these derangements, including the possible implementation of serial examinations, may assist in managing these critically ill patients by providing prognostic indicators, stratification for more intensive surveillance, and any necessary interventions (160). Even appropriate anticoagulation may not eliminate a PE. Several diagnostic tests are available, including a 64-cut chest CT, MRI, pulmonary angiography, and echocardiography (Fig. 25.11 and Table 25.9) (154).
The classic echocardiographic signs for a PE are the following:
- Dilation of the chamber and thinning of the right ventricle wall with global hypokinesis
- Pulmonic insufficiency
- Tricuspid insufficiency
- RA dilatation with decreased atrial function and abnormal atrial septal motion
- Septal flattening or paradoxical motion of the ventricular septum into the left ventricle
- Increased ratio of RV/LV dimensions
- Pulmonary artery hypertension
- Dilation of the pulmonary artery
- Identification of thrombi
If the patient’s RV function is normal until the event, because of its innate inability to tolerate acute pressure overload, these echocardiographic events would occur acutely, and catastrophic events would result when 75% of the pulmonary vasculatures are obstructed. Earlier signs may manifest with as little as a 25% obstruction of the pulmonary vasculature (161). According to the International Cooperative Pulmonary Embolism registry, the presence of RV hypokinesis is associated with increased mortality at 30 days even with a systolic systemic pressure greater than 90 mmHg (162).

FIGURE 25.11 Enlarged right ventricle (RV) in parasternal short axis view. LV, left ventricle. (See also Video 25-6.)
| TABLE 25.9 Imaging and Biomarker Findings Suggestive of Higher Risk in PE Patients |
 |
If the patient exhibits pre-existing chronic pulmonary artery hypertension with RV hypertrophy, thrombosis of the right-sided circulation may be initially better tolerated. Eventually, RV failure will ensue and dominate the cardiovascular presentation (158,171). Morris-Thurgood and Frenneaux (172) describe RV and RA pressures with reversal of the transseptal diastolic pressure gradient when intravascular volume replacement is attempted to enhance diastolic ventricular interaction. In the situations where other diagnostic tests may fail, echocardiography is a useful diagnostic tool to determine RV afterload and associated hemodynamic findings significant for PE (154–158,162).
Tricuspid annular plane systolic excursion (TAPSE) is a measure of the distance of the systolic excursion of the RV annular segment along its longitudinal plane, obtained in the apical four-chamber view. TAPSE greater than 1.6 cm is considered indicative of normal RV function, less than 1.6 cm implies impaired RV function. One of the assumptions is that the displacement of the basal segment is representative of the entire RV. In a consensus document, it was summarized that the advantages include that it is simple, less dependent on optimal image quality, reproducible, and does not require sophisticated equipment or prolonged image analysis. It also commented disadvantages include that it is angle dependent, there are no large-scale validation studies, assumes a single segment represents the whole function, load dependent, and affected by LV dysfunction (173,174). In more recent reports, patients with TAPSE less than 1.6 cm had greater all-cause mortality at 30 days, and was also associated with most other markers of RV failure (RV end-diastolic diameter, RV/LV end-diastolic diameter, systolic pulmonary artery pressures) (174,175).
Right ventricular infarction and/or failure are one of the most difficult clinical entities to support. Diagnosis of isolated failure or biventricular failure alters the management of these complex patients. Inferior myocardial infarction is associated with RV infarction (35%) (176,177). The classic findings are tricuspid regurgitation, a dilated thinned RV, severe global hypokinesis, reduced descent of the base of the RV free wall (apical four-chamber view), and plethora of the IVC without any respiratory variations in its diameter. In diastole, there is flattening of the ventricular septum and occasional paradoxical motion and, at times, bulging of the septum into the LV, indicative of a right-sided pressure/volume overload situation. The RA may reveal right atrial hypertension with displacement of the interatrial septum (176–178). If there is coexisting patent foramen ovale (PFO) in the presence of RV and/or RA afterload, a right-to-left shunt is possible through the atrial septum, resulting in hypoxemia and thus complicating the clinical presentation. The identification of a PFO is greatly enhanced by choosing TEE over the surface approach (179).
Pericardial Disease and Tamponade
Echocardiography is an ideal technique to detect pericardial maladies such as pericardial effusions leading toward tamponade (acute vs. chronic), restrictive versus constrictive pericardial disease processes, and infiltrative processes, infective or not (congenital, neoplastic, metabolic, radiation-induced, iatrogenic, and traumatic) (180,181).
Pericardial effusions can readily be identified by either the surface or esophageal approach. In the parasternal long-axis view, the pericardial fluid is most frequently seen posterior to the left ventricle and atrium, and tapers anterior to the descending aorta. In larger effusions, it may be seen anterior to the right ventricle (Fig. 25.12). When the effusion is posterior and/or loculated (regional), the surface image may bypass its presence. Regional tamponade is not securely identified but may be juxtaposed to either ventricle and/or may involve the right atrium, vena cava, or pulmonary veins. The detection of a pericardial effusion ensures the diagnosis of a pericarditis. However, a patient with fibrinous acute pericarditis may often present with a normal echocardiogram. When fluid is detected, the clinician may proceed to drain it and determine if it is of an infectious cause (exudative), a complication of CHF (transudative), or traumatic in nature (hemorrhagic) (147).

FIGURE 25.12 Pericardial effusion. A: Parasternal long axis showing pericardial effusion, seen tapering anterior to descending aorta (Ao). LV, left ventricle; RV, right ventricle; LA, left atrium. B: Parasternal short axis showing pericardial effusion. (See also Video 25-7.)

FIGURE 25.13 A: End-diastolic pressure–volume in two ventricles with differing passive diastolic properties. Chamber stiffness is dP/dV at any point on the end-diastolic pressure–volume relation. The stiffer chamber on the left has a steeper overall slope. B: Same data plotted as pressure versus chamber stiffness. Because of the exponential nature of the end-diastolic pressure–volume relation, the relation between chamber stiffness and pressure is a straight line whose slope is the chamber stiffness constant (kc) that characterizes the overall slope of the end-diastolic pressure–volume relation. A similar relationship holds for stress and strain. (Reproduced from LeWinter MM, Osol G. Normal physiology of the cardiovascular system. In: Hurst’s the Heart. 11th ed. New York, NY: McGraw-Hill; 2004:S342, with permission.)
In the syndrome of CHF (14%), myocardial infarction (15%), and valvular heart disease (21%), pericardial effusion is relatively common and may proceed to a tamponade syndrome (182,183). In cardiac surgical patients, the vast majority will have an effusion that presents usually on the second postoperative day and maximizes toward the 10th day (184). Fortunately, cardiac tamponade is unusual in these surgical patients, typically averaging 1% of the cases, with the exception of the cardiac transplanted patient in whom a higher frequency can result from repeated mediastinal procedures or rejection (185,186). Of interest, female gender, valvular intervention, and/or anticoagulants are predisposing factors (187).
An asymptomatic patient with chronic effusive pericarditis can present with a large effusion (188). Etiologic factors of this chronic process include uremia, neoplasm, tuberculosis (knobbed calcified pericardium), and connective tissue disorders (189). Typically, extensive effusion without any inflammatory disorders can be associated with a malignancy (188,190).
Echocardiography easily characterizes the relative contributions of cardiac enlargement or encroachment on the atrial/ventricular chambers and their ventricular and atrial performance, identifying underlying physiologic hemodynamic aberrations. Via M-mode echocardiography, one will see an echo-free space between the visceral and parietal pericardium dynamically throughout the cardiac cycle (Fig. 25.13).
If during systole there is a prominent separation, the fluid extent is deemed important. This modality is quite sensitive, as is two-dimensional echocardiography, which can detect small (less than 5 mm), moderate (5 to 10 mm), or large (greater than 10 mm) fluid amounts, as well as its global or regional involvement. As stated earlier, as the fluid volume increases, it will extend from the posterobasilar LV apically and then anteriorly, subsequently lateral and posterior to the LA (Fig. 25.14).
Drainage is performed for diagnostic purposes (e.g., infectious pathogens, cancer) or therapeutic reasons (hemodynamic compromise or pericardial tamponade) (187,191,192).
In regard to the end of this dynamic progression of fluid involvement, cardiac tamponade becomes a life-threatening event that must be correctly identified, diagnosed, and relieved in an expeditious fashion (193,194). Dynamic tamponade presentation depends on several physiologic considerations: the underlying ventricular performance; the rate of its development (increasing pericardial pressures in contrast to the intracardiac pressures with elevating venous pressures and decreasing to negative transmural pressures); the inherent intracardiac pressures, particularly of the ventricles; and the presenting intravascular volume or preload, especially in a hemorrhagic condition. If the patient has pre-existing RV afterload and/or pulmonary artery hypertension, the echocardiographic findings will be delayed because of the abnormal RV loading conditions. Normally, the diastolic collapse of the RV—depicted as abnormal posterior motion of the anterior RV wall during diastole—indicates that the pericardial pressure is exceeding the early diastolic RV pressure. In other words, the RV diastolic transmural pressure is negative (195). In contrast, if the patient’s underlying LV systolic dysfunction is impaired, the echocardiographic characteristics of tamponade will present earlier in the hemodynamic “fluid” progression with smaller volumes (196).

FIGURE 25.14 The four phases of diastole are schematically shown and include the isovolumic relaxation time (IVRT), which begins with aortic valve closure and extends to mitral valve opening, rapid early filling (RFP), diastasis, and atrial systole. Doppler E and A waves are superimposed. Note the points of left atrial–left ventricular (LA–LV) crossover and their relation to the mitral filling waves (MVF).
The echocardiographic indicators of pericardial tamponade include the following:
- Decrease in end-systolic and end-diastolic dimensions
- Relative increase in RV dimensions during spontaneous ventilation (inspiration) as compared to an increase in LV dimension
- RA diastolic collapse
- LV diastolic inversion
- Greater than 50% decrease in transmitral inflow
- Decrease in aortic flow velocities during inspiration
A large pericardial effusion (greater than 10 mm) may reveal a “swinging” heart throughout the cardiac cycle. In contrast, flow across the tricuspid valve and pulmonary flow velocities (PVFs) increase dramatically during inspiration, primarily in the systolic component of the PVF (197). Even though RV diastolic collapse is a sensitive indicator of tamponade, different loading conditions with varied ventricular performance will lower its specificity. RA diastolic volume is an even more sensitive (100%) marker for tamponade but, again, its specificity is not the best (198).
Of note, if the duration of RA diastolic collapse exceeds one-third of the cardiac cycle, the specificity increases (198). LA collapse is not usually detected (25%), but when it does exist, the specificity is markedly higher. LV diastolic collapse is much less common, probably due to the ventricular chamber properties (199–201). As in any dynamic hemodynamic setting, clinical conditions may vary, and pericardiocentesis is not necessary in every case of pericardial effusion. The absence of any chamber inversion has a high negative predictive value (92%), with the positive predictive value reaching 58%. Abnormal right-sided venous flows carry 82% and 88% positive and negative predictive values, respectively, for pericardial effusion (202).
If the pericardial fluid increases rapidly, the patient may initially have no prominent symptoms or may have only shortness of breath, with or without chest pain. Shortly thereafter, the patient will deteriorate to systolic hypotension, venous hypertension (distended jugular veins), and pulsus paradoxus. In the volume-depleted patient, these findings might not be initially present until rapid repletion of preload unmasks these characteristics (203).
Diastolic filling is also limited in constrictive pericarditis. Normal thickness of the pericardium does not preclude this diagnosis, which can be surgically confirmed in 28% of the cases of a negative series (204). The observed venous patterns of constrictive pericarditis from tamponade are characteristic. Because the ventricular chambers are fixed in volume by the pericardium, venous return is unimpeded during ejection, thereby ablating the normal venous surge during systole. Cardiac compression at end systole does not occur, so when the tricuspid valve opens the return of flow into the ventricle, it is of higher velocity, resulting in a biphasic venous return with a diastolic component faster than the systolic component (147). In contrast with tamponade, during inspiration in constrictive pericarditis, the decrease in intrathoracic pressure is not transmitted to the heart, and venous return does not fall (147,205). TEE measurement of the LV wall is markedly better than the surface approach (206,207).
The echocardiographic findings of this type of pericarditis include the flattening of the LV posterior wall, abnormal posterior septal motion in early diastole, rapid atrial filling, and the occasional premature opening of the pulmonic valve due to elevation of the RV pressure above the pulmonary artery pressure. Via the M-mode modality, there may be notching of the ventricular septum during early diastole or atrial systole secondary to a transient reversal of ventricular septal transmural pressure gradient (208). The above findings are not highly sensitive, yet a normal examination essentially excludes the diagnostic presence of constrictive pericarditis (209). Via two-dimensional echocardiography, the sonographer will detect dilation or lack of collapse of the hepatic veins and IVC, biatrial distention, and an abnormal contour between the LA and LV posterior walls. LV performance may be preserved unless there is a mixed pattern of restrictive–constrictive physiology (210,211). By applying Doppler techniques, the E velocities and E/A ratios on LV and RV inflow increase (due to the abnormal rapid early diastolic filling-restrictive pattern). In constrictive pericarditis, there is a prominent early diastolic velocity Ea when interrogated by tissue Doppler. The linear response to LA pressure increases, and the ratio of E/Ea is inverted (212).
When evaluating propagation velocity with color M-mode Doppler, the early diastolic transmitral flow is greater than 45 cm/s (212). These findings are counterintuitive to restrictive pathology and filling with reduced Ea (less than 8 cm/s) (213,214). A classic characteristic of constrictive pericarditis is when the mitral inflow velocity decreases up to 40% while flow through the tricuspid valve is greatly enhanced in the first cardiac cycle after inspiration. In concert, the respiratory variation in PVF is markedly influenced (215,216). When there is coexisting elevated LA pressure, this exaggerated transmitral inflow velocity may not be apparent (215,217). Even though there is an increased velocity in the PVF, especially during expiration, the ratio of S/D is reduced even further by affecting the diastolic component (218). Figure 25.15 describes in detail the comparisons and dissimilarities in the restrictive and constrictive pathologies (147).
Penetrating cardiac injury should be briefly presented here considering that it is a unique pathology with life-threatening lesions that are not always obvious by routine clinical examination (219). If the patient arrives at a definitive tertiary care setting alive, immediate control of the hemorrhage should be attempted, at times with an immediate thoracotomy in the emergency department or in the operating room (220,221). A bloody effusion may be contained in the pericardial space (if there is a contiguous pathway to the thorax) or extend externally, followed by profound shock and rapid death by exsanguination. The lesions have multiple configurations, ranging from a ventricular mural wound to small, irregular, and multiple lesions. In obvious cases, surface echocardiography may identify pericardial tamponade and/or large lesions (ventricular septal defect [VSD]). Following resuscitation, the clinician should further investigate the clinical picture via TEE, since small lesions—yet significant and potentially fatal—may be missed, including VSD, defects through valve leaflets, intracardiac thrombi, or regional tamponade (222,223). One of the largest studies to date on this topic is by Degiannis et al. (224). In a 32-month period, 117 patients with penetrating injuries of the mediastinum were evaluated retrospectively. A 17% mortality by stabbing was observed, whereas victims with gunshot wounds (GSW) revealed an expected higher mortality of 81% (194). Another series revealed a 7% occult injury, with a similar mortality rate contrast between GSW and stab wounds (221). The clinician should always keep in mind that these patients are a complex challenge and that hemodynamic stability does not preclude an unexpected malady. Complacency should not occur (222,223).

FIGURE 25.15 Approach to diagnostic use of echocardiography. IE, infective endocarditis; TTE, transthoracic echocardiography; TEE, transesophageal echocardiography. (Reproduced from Bayer AS, Bolger AF, Taubert KA, et al. Diagnosis and management of infective endocarditis and its complications. Circulation. 1998;98:2936–2948, with permission.)
Assessment of Myocardial Performance
Early focused echocardiography is recommended in circulatory and/or respiratory failure. It can improve early diagnostic accuracy from 50% (delayed performance after 15 minutes) versus 80% (performance immediate on presentation) (224). Although evaluation of the heart is mainstay, thoracic ultrasonography should include the evaluation of the pleura. The primary utility of thoracic ultrasound would be to exclude diagnoses like pericardial tamponade, severe ventricular systolic dysfunction, pulmonary fluid overload, and large pleural effusions.
In extrapolating the information reviewed in the sections of LV performance and pericardial disease, echocardiography is found to be an extremely useful diagnostic tool that can be used in a timely manner to delineate the cause of the shock state, whether hypovolemia, hyperdynamic derangements—type B metabolic lactic acidosis (sepsis, septic shock, liver failure, heavy metal poisoning)—and myocardial injury. An echocardiographic examination is easily performed, and the information obtained can avoid the placement of a PAC. The initial echocardiographic observation evaluates LV function and volume. In a hypovolemic condition, the ventricle exhibits systolic cavitary obliteration, with turbulence in the left ventricular outflow tract (LVOT) seen via color-flow Doppler. In extreme hypovolemia, the distal anterior leaflet of the anterior mitral valve in systole will cause obstruction to flow (225). This condition is amplified if relative hypovolemic states and tachycardia are observed in patients with hypertrophic obstructive cardiomyopathy (HOCM). Some of these echocardiographic indicators of a decreased preload state may be observed in patients who appear clinically normovolemic, regardless of baseline ventricular function (225).
Ventricular performance and ventricular interactions and loading conditions are quite complex in sepsis, SIRS, and septic shock. Echocardiography may clarify the effects of medical and/or pharmacologic interventions in these profoundly critically ill patients. However, often their physiologic effects are affected by the inherent (premorbid) chamber physical properties (pressure/volume characteristics) or fluid dynamics. A paradoxical response between survivors and nonsurvivors can be observed when a Frank–Starling curve is plotted against volume load in an animal model. The greater the end-systolic and end-diastolic volumes, the better the chance for survival (226). Furthermore, a paradoxical decrease in the slope of isovolumetric/pressure line (an index of contractility that is load independent) is associated with a decrease in cardiac compliance but increase in survival (227).
The effect of sepsis cardiomyopathy may result in a lower EF (which is load dependent) with high cardiac output, tachycardia, higher stroke volume, and elevated mixed venous saturation. As the patient deteriorates, hypotension occurs, impairment of cellular function follows, and the global ventricular volume response to resuscitation and fluid becomes ineffective (228–231). If there is no normalization of the above parameters within 48 to 72 hours, the chance for survival greatly diminishes. Persistent tachycardia is a marker of death. An apparent sympathovagal imbalance increases heart rate variability in the adult and pediatric patient populations. Atrial dysrhythmia and dysfunction are common in the clinical presentation and the progression of sepsis. TEE is obviously a valuable diagnostic tool for evaluating atrial function and volume by reviewing the LA appendage flow characteristics in concert with analysis of ventricular function and volume, ventricular interaction of dependency, transmitral inflow velocities, and pulmonary venous flow patterns (231,232).
In sepsis or SIRS, the right ventricle responds to fluid loading, but at some unknown end point, when the volume and pressure are exceedingly high, the compensatory response is no longer beneficial and mortality dramatically rises. A transitory increase of pulmonary artery pressure appears to be associated with increased mortality, but no serial investigations have been completed (233,234). In a clinical investigation by Poelaert et al. (235) based on transmitral inflow velocities and pulmonary venous flow patterns, patients with a decreased transmitral inflow velocity, abnormal pulmonary venous flow, and decrease in fractional area contraction are more likely to die as compared to two other subgroups. This pattern is particularly seen in older patients.
The hyperdynamic circulatory response of sepsis was earlier associated with a myocardial depressant factor (236) and presently is related to various mediators, cytokines, and humoral factors that are all related and intertwined (237). Interestingly, it is now known that there is a protective effect of early exposure to some of these mediators/cytokines that can induce the reversal of myocardial depression (228,230,238,239).
In summary, appreciating cardiac function in septic shock patients will assist in the determination of the pharmacologic interventions, fluid augmentation, and other modalities (240–242). It is intuitive reasoning that if the baseline cardiac junction is poor, the volume should be instilled judiciously and adjunct pharmacologic measures should be administered earlier and more aggressively. Echocardiography is a useful tool to initially identify and follow all hemodynamic variables. This diagnostic tool alone might suffice, but until further data are available, using it in conjunction with invasive monitoring is crucial (228,230,238,243).
Integration of Lung Ultrasound
Lung ultrasound has increasingly been incorporated into various components of critical care ultrasound evaluation of patients. In the well-known FAST (Focused Assessment with Sonography in Trauma), lung ultrasound is increasingly used to identify hemopneumothoraces with extended evaluation toward the lungs in the mid-axillary line. In evaluation of the cardiac function, it may be useful to evaluate the lungs to identify fluid overload states. Regardless of the function identified on cardiac evaluation, the finding of fluid overload during the lung examination suggests the patient may benefit from inotropic/vasopressor agents earlier in the course of the disease process (sepsis, multitrauma injury, cardiogenic shock). On the other hand, a patient with decreased cardiac function may benefit from judicious use of fluids if one can identify a lung examination that is not indicative of fluid overload state (e.g., CHF patients in septic shock). Several new studies over the past 10 years with growing terminologies with differences in evaluation, approach, nomenclature, and techniques of evaluation have led to international evidence-based recommendations for point-of-care lung ultrasound (244). Many times transportation of emergently ill patients is impossible and the ability to evaluate the lung at bedside can be very helpful in decision-making for the treatment plan. The “BLUE” protocol and “ICU Sound” protocol both found that diagnostic accuracy of lung ultrasound to differentiate dyspneic patients has increased greatly (1,245). The emergent question that must be answered when evaluating the hypotensive or critically ill patient is what is the fluid status of my patients (overload, depletion, euvolemic)? This can be answered by using ultrasound to evaluate the lung viscera/pleural interface and searching for “B” lines and “lung sliding.” Lung sliding is the side-to-side movement of the pleural line with breathing. Lung sliding is the regular rhythmic movement synchronized with respiration that occurs between the parietal and visceral pleura that are in direct contact (without air between them). Lung sliding can be absent in pneumothorax, a mainstem intubation (on the left side), disease processes that affect the lung/chest wall interface such as pneumonia, acute respiratory distress syndrome (ARDS), and interstitial lung processes (inflammatory processes). The transducer is placed with the probe marker toward the patient’s head and the operator should start the examination with the transducer on the sternum. The image obtained will be a shadow artifact from bony sternum. First, move toward the right anterior chest and then move laterally toward the posterior thorax. Multiple areas can be studied (Fig. 25.16). A more rapid two-region scan may be sufficient in some cases (anterior and mid-axillary chest positions in the supine patient). The view you should obtain here includes rib shadows, chest wall, and pleural interface. Lung sliding can be better appreciated by decreasing the ultrasound depth to maximize the lung/chest wall interface, approximately 1.5 cm below the rib shadow artifacts (Fig. 25.17). In a patient with no fluid overload state, “A lines” will be seen all throughout the lung fields. “A” lines are reverberation artifacts of the pleural line, hyperechoic, and horizontal (Fig. 25.18). “B” lines are vertical hyperechoic reverberation artifacts that arise from the pleural line and extend to the bottom of the ultrasound screen without fading. These lines can either be associated with lung sliding or not associated with lung sliding. B lines with lung sliding appear to move left and right on the screen similar to flashlights on the screen. B lines without lung sliding do not move with respiration. The anatomic and physical basis of B lines is not clear at this time, and could be related to alveolar wall thickening. Multiples of these lines are the sonographic sign of lung interstitial syndrome. A positive region is defined by the presence of more than three B lines in a longitudinal plane between the ribs, although it may be more important to perform serial examinations to see increase or decrease of these lines (Fig. 25.19). Focal B lines can be present in normal lung. In cardiogenic pulmonary edema, these B lines are associated with lung sliding, with homogenous distribution in anterior bilateral chest examination, and “spared” areas are not observed, and the pleural line is rarely involved (246). Pulmonary edema produces a transudate in this scenario, which is not supposed to generate inflammatory adherences (a factor that may affect lung sliding). In contrast, the findings in diffuse parenchymal lung disease include pleural line abnormalities (irregular, fragmented pleural line), subpleural abnormalities (small echo-poor areas), and nonhomogenous distribution of B lines. In ARDS, anterior subpleural consolidations, absence of lung sliding, “spared” areas of normal parenchyma, pleural line abnormalities (irregular fragmented pleural line), and nonhomogenous distribution of B lines can be found (247). Evaluation of B lines allows monitoring of response to therapy in cardiogenic pulmonary edema. Chest radiography can be used to diagnose pulmonary edema, but overall accuracy may be as low as 69% and findings of pulmonary edema can lag behind clinical changes (248,249). Many studies have now shown that lung ultrasound can be used to distinguish between cardiogenic and noncardiogenic causes of dyspnea (250,251). Also, B lines have been shown to correlate with more recognized methods of identifying pulmonary edema. Chest radiography (252), CT (253), pulmonary capillary wedge pressure, quantitative measurements of extravascular lung water, and natriuretic peptide levels have all been correlated to B lines using lung ultrasound (254,255). The presence of B lines has also been shown to be dynamic, disappearing in patients undergoing hemodialysis (256).

FIGURE 25.16 Anterior lung zones sites of evaluation: 1 to 2 cm lateral to the sternum and then in the upper/mid-axilla region.
Related posts:


Stay updated, free articles. Join our Telegram channel

Full access? Get Clinical Tree


