Critical Care Medicine
Adult Critical Care
A Description of Intraoperative Ventilator Management in Patients with Acute Lung Injury and the Use of Lung Protective Ventilation Strategies
Blum JM, Maile M, Park PK, et al (Univ of Michigan Health System, Ann Arbor) Anesthesiology 115:75-82, 2011§
Evidence Ranking
• C
Expert Rating
• 2
Abstract
Conclusion
Similar ventilation strategies are used between patients with ALI and those without ALI. These findings suggest that anesthesiologists are not using lung protective ventilation strategies when ventilating patients with low Paco2/Fio2 ratios and ALI, and instead are treating hypoxia and ALI with higher concentrations of oxygen and peak pressures (Figs 2, Tables 4 and 5).
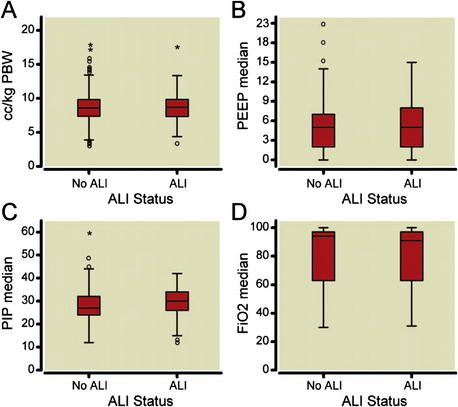
 represent outliers (1.5–3 X box length), * represent extreme outliers (more than 3 X box length). (B) Median positive end-expiratory pressure (PEEP) by ALI status. Solid lines represent median values, boxes represent the interquartile range, T bars represent 95% of total sample,
  represent outliers (1.5–3 X box length), * represent extreme outliers (more than 3 X box length). (C) Median PIP by ALI status. Solid lines represent median values, boxes represent the interquartile range, T bars represent 95% of total sample,
  represent outliers (1.5–3 X box length), * represent extreme outliers (more than three times box length). (D) Median F
 represent outliers (1.5–3 X box length), * represents extreme outliers (more than 3 X box length). ALI = acute lung injury; F
Related posts:
 of change in daily step count over five years with insulin sensitivity and adiposity: population based cohort study
of Cancer: The Next Generation
Beverages and Risk of Metabolic Syndrome and Type 2 Diabetes: A meta-analysis
time and haemodynamic response after thiopental vs. propofol in the elderly: a randomized trial
monitoring of neuromuscular block over the orbicularis oris muscle in anesthetized patients receiving vecuronium
Is Better Than General Anesthesia During Endovascular Acute Stroke Interventions
of change in daily step count over five years with insulin sensitivity and adiposity: population based cohort study
of Cancer: The Next Generation
Beverages and Risk of Metabolic Syndrome and Type 2 Diabetes: A meta-analysis
time and haemodynamic response after thiopental vs. propofol in the elderly: a randomized trial
monitoring of neuromuscular block over the orbicularis oris muscle in anesthetized patients receiving vecuronium
Is Better Than General Anesthesia During Endovascular Acute Stroke Interventions
Stay updated, free articles. Join our Telegram channel

Full access? Get Clinical Tree


