KEY POINTS
Critical care therapeutics should be individualized to maximize therapeutic effect while minimizing the potential for adverse drug reactions.
The appropriate loading dose is determined primarily by the volume of distribution of the drug in the patient.
The maintenance dose is proportional to the clearance and the desired steady-state plasma concentration.
Elimination half-life is inversely proportional to clearance and directly proportional to volume of distribution.
Steady-state conditions are obtained after the passage of three to five half-lives.
Prospective consideration of possible drug-patient and drug-drug interactions minimizes the potential for undertreatment or adverse drug reactions.
Therapeutic drug monitoring may follow purely pharmacodynamic parameters or additionally use plasma levels to calculate pharmacokinetic parameters.
Therapeutic drug monitoring attempts to ensure adequate therapy and to prevent, detect, and appropriately report adverse drug reactions.
Systemwide changes in management of critically ill patients, including physician order entry systems and dedicated intensivists and pharmacists, can potentially decrease the incidence of adverse drug reactions.
Individualization of critical care therapeutics through the application of pharmacologic principles is intended to reconcile important features of ICU management including polypharmacy, altered drug disposition, and cost considerations, in the design of a rational drug regimen. Critically ill patients routinely receive multiple medications, and the potential for adverse drug reactions (ADRs), particularly drug-drug interactions, increases in proportion to the number of agents received. Furthermore, physiologic changes resulting from critical illness may alter several aspects of drug disposition in a manner that is often difficult to predict based on available information. Finally, rational critical care therapeutics is a major component of providing cost-effective critical care, because of the substantial fraction of the average hospital pharmacy budget consumed by critical care therapeutic agents.
Individualization of pharmacotherapy attempts to avoid ADRs caused by drug overdosage or undertreatment, including ADRs caused by drug-drug and drug-patient interactions. Correct drug dosing is frequently complicated in critical illness by alterations in bioavailability, volume of distribution, and elimination.1 Errors in choosing a therapeutic regimen are frequently poorly tolerated by these patients; rapid efficacy may be necessary for survival, but physiologic reserve may also be inadequate to withstand the effects of drug intoxication. Concentrating efforts on optimal dosing of drugs that have a low therapeutic index (low ratio of toxic to therapeutic plasma level) is therefore particularly important. Consideration of pharmacokinetic (PK) and pharmacodynamic (PD) principles, and their application to design an approximate patient model for individualized therapeutics, should precede addition of any new drug to an ICU patient’s regimen. Furthermore, the dynamic physiology of these patients mandates frequent reassessment of the accuracy of this model, updating drug regimens as required. Therapeutic drug monitoring is used to titrate therapy with drugs that have both a low therapeutic index and readily measurable plasma concentrations that are proportional to drug effects (therapeutic and toxic). Finally, any change in the status of an ICU patient must be considered to be potentially the result of an adverse drug reaction, especially in the absence of a clear-cut explanation.
PHARMACOKINETIC AND PHARMACODYNAMIC PRINCIPLES
Pharmacokinetics is the study of drug movement through the body,2-7 encompassing all aspects of drug disposition (“what the body does to the drug”), including (1) entry, (2) distribution, and (3) elimination. The three most important quantifiable PK parameters considered in evaluating the disposition of a drug are therefore (1) bioavailability (fraction of administered dose reaching the systemic circulation), (2) volume of distribution, and (3) clearance (elimination by biotransformation and/or excretion). Pharmacokinetic models divide the body into one or more compartments (see below), so that drug disposition may be described by a series of mathematical equations. Pharmacodynamics refers to the relationship of drug movement to pharmacologic response (“what the drug does to the body”). The relationship between PK data and the PD phenomenon of drug effect is based on the drug-receptor complex theory, which states that there is a correlation between drug concentrations in the plasma and at the receptor site, and that drug effect is proportional to the extent of drug-receptor complex formation.
The fraction of administered drug reaching the systemic circulation is termed its bioavailability. Intravascular injection generally results in 100% bioavailability. Other parenteral routes (intramuscular, subcutaneous, transdermal, intraperitoneal, and inhalational) and enteral (oral, through enteral feeding tubes, and rectal) of administration often achieve bioavailability which is both less complete and less predictable, although selected agents administered by the sublingual, inhalational, and other routes may undergo extensive and rapid absorption. Formulation properties (eg, elixir vs tablet) and the physicochemical properties (eg, lipid solubility and degree of ionization at gastric pH) of the administered drug can substantially affect systemic bioavailability, particularly following enteral administration. Enterally administered agents, except drugs administered by sublingual or rectal routes, are uniquely subjected to the potential influence of first-pass (presystemic) metabolism of drug by gut flora and by intestinal and liver enzymes (see below), which tends to decrease the systemic bioavailability of the parent compound.4,6,8 Presystemic metabolism may result in the production of metabolites that are inactive (eg, most propranolol metabolites), or active (4-hydroxypropranolol from propranolol, morphine from codeine, or enalaprilat from enalapril) following enteral substrate administration. Agents requiring metabolism to an active metabolite to elicit pharmacologic response, such as enalapril and codeine, are commonly referred to as prodrugs. Locally administered drugs (eg, intraperitoneal antibiotics for peritonitis or intraocular β-blocking agents for glaucoma) are intended for local effects, but it is important to remember the potential systemic absorption and systemic effects of these drugs. In addition to the factors that determine extent of absorption, drug formulation can be manipulated to alter the rate of drug absorption (eg, standard-release vs extended-release preparations), which will in turn potentially blunt the peak drug concentration obtained after drug administration. Important considerations in choosing the route of drug administration in the critically ill patient will be further discussed below.
The simplest compartmental PK model describes the body as a single homogenous compartment. An amount or dose of drug (D) is administered intravenously, instantaneously distributed into a space of volume (Vd), and the immediate serum or plasma concentration (C) measured. Given these simplifications, the volume of this theoretical compartment Vd (the apparent volume of distribution) may be calculated: Vd = D/C, since C = D/Vd. By assuming instantaneous distribution and concentration sampling (before any elimination has occurred), this model describes the theoretical volume into which the administered drug must be distributed in order to produce the observed drug concentration (Fig. 125-1A). The volume of distribution of most drugs does not usually correspond to a physiologic volume (such as the extracellular fluid volume [0.2 L/kg] or total body water space [0.5 to 0.7 L/kg]), but is often many times larger than the total body volume; drugs with a large volume of distribution are usually characterized by low plasma protein binding, high lipid solubility, and extensive tissue binding.
FIGURE 125-1
Linear pharmacokinetic profile with a single-compartment model. A depicts the plasma concentration (Cp, µg/mL) versus time (hours) curve following intravenous administration of an 800-mg drug dose to a 100-kg adult. The first plasma sample, obtained 2 hours after bolus administration, contains a measured drug concentration of 32 mg/mL. Subsequent samples reveal that the plasma drug concentration declines by 50% every 2 hours, consistent with an elimination half-life of 2 hours. B shows the semilog plot of the same data plotted in panel A. Log transformation of the plasma concentration values yields a linear plot, consistent with first-order elimination. Back-extrapolation to time 0 suggests that the plasma concentration at this time was 64 µg/mL (Cp0); assuming instantaneous complete distribution, Vd is estimated (Vd = dose/Cp0 = 800 mg divided by 64 µg/mL = 12.5 L, or 0.125 L/kg). The slope (ke) of the log-linear plot is 0.3465 h–1, consistent with the known half-life (t1/2) of 2 hours (ke = 0.693/t1/2). Clearance (CL) may be estimated using the equation CL = ke × Vd = 0.3465 × 12.5 = 4.33 L/h = 72 mL/min.
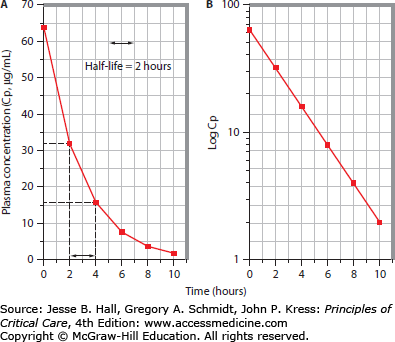
Drugs whose disposition may be described by a one-compartment kinetic model exhibit log-linear plasma concentrations as a function of time, thus exhibiting “simple” or “linear” pharmacokinetics (see Fig. 125-1B). Since the absolute rate of drug elimination is a linear function of its plasma concentration, and the fraction of drug eliminated per unit time is constant, a “first-order” kinetic model applies. Following a single intravenous bolus (and assumed instantaneous complete distribution), plasma drug concentration declines owing to a first-order elimination process (biotransformation and/or excretion), so that a semilogarithmic plot of the logarithm of plasma drug concentration (log Cp) versus time yields a linear graph. Back-extrapolation of this graph to time zero permits estimation of the plasma drug concentration immediately following the bolus (Cp0), and thus an estimate of Vd, since Vd = D/C. The slope of this plot is called the elimination rate constant k (or ke).
The kinetics of drug elimination by this first-order process are described by the equation:
where Cp(T2) and Cp(T1) are the plasma drug concentrations at later and earlier measurement points, respectively; T2 − T1 is the time elapsed between these two time points; and k is the elimination rate constant (in units of time–1).
The elimination half-life (t1/2) of the drug, which is the amount of time required for the plasma drug concentration to decrease by 50%, can be determined from the elimination rate constant by the equation:
Using the above equation, it can be shown that the drug concentration declines by 50% during each half-life, so that little of the bolus dose remains after four to five half-lives (Table 125-1). Alternatively, if a drug is eliminated by a saturable process, elimination may become saturated at high concentration, so that kinetics become zero order (a constant amount of drug, rather than a constant fraction, is eliminated per unit time). The half-life of elimination of such agents is concentration dependent, because of capacity-limited (saturable) clearance, and PK assessment requires the use of Michaelis-Menten kinetics. Small dose escalations may result in disproportionately large plasma concentration increments when the maximum metabolic capacity is exceeded. Ethanol, phenytoin, and salicylic acid are examples of drugs with capacity-limited clearance, and many other agents develop saturation of metabolic pathways in overdose (see Chap. 124).
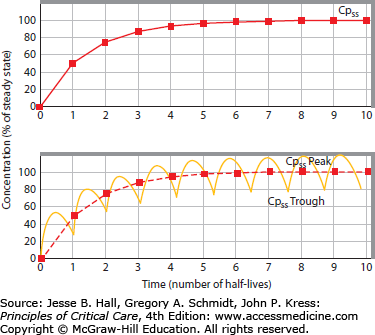
If the same drug given above as a bolus to estimate simple (single-compartment) PK parameters is instead administered as a continuous intravenous infusion, and the rate of infusion exceeds the rate of simultaneous (first-order) elimination, then the plasma drug concentration will increase as accumulation occurs. Eventually, since the amount of drug excreted per unit time increases with increasing plasma drug concentration, the elimination rate becomes equal to the rate of administration; the plasma drug concentration at this time, which from then onward remains constant (unless the rates of administration or elimination change), is termed the steady-state concentration (Cpss) (Fig. 125-2, upper panel). Accumulation of an agent exhibiting linear pharmacokinetics proceeds in a fashion which is the mirror image of its elimination following a single intravenous bolus (Table 125-2). Accumulation of intermittently administered drugs differs from constant intravenous infusion only in the presence of peak and trough plasma drug concentration fluctuations; steady-state still develops over the same number of half-lives, with peak to-trough fluctuations around a mean Cpss (see Fig. 125-2, lower panel). Therefore, one can use the concept of half-life to estimate the time to attainment of a steady-state plasma drug level (and pharmacologic effect) following initiation of therapy, and to offset the drug effect following discontinuation of the agent, regardless of the dosing regimen in use.
FIGURE 125-2
Drug administration by continuous intravenous infusion (upper panel) or intermittent intravenous bolus (lower panel). Attainment of steady-state plasma concentration (Cpss) occurs after three to five half-lives, regardless of the dosing regimen. Peak and trough fluctuations around Cpss are aimed to each be within the therapeutic range (therapeutic but subtoxic plasma levels).
The conceptually simple linear PK profile of a drug that fits a single-compartment model is actually inadequate to fully describe the disposition of most drugs. Multicompartmental models more accurately describe the rate and extent of drug shifts between these spaces, requiring multiple slope calculations to include the effects of intercompartmental distribution and elimination from the body (Fig. 125-3).3 Such models divide the body into a central (the blood volume and highly perfused tissues, Vdc) and one or more peripheral or tissue (fat, muscle, or skin) compartments. The final volume of distribution (Vdtot) reflects the sum of central and tissue compartments. Vdc is calculated by measuring the instantaneous plasma concentration (Cp0) after an intravenous drug dose is administered (Fig. 125-4A), then Vdtot is calculated by back-extrapolation from the elimination phase of the plasma concentration versus time curve to the y-axis (concentration) at zero time (see Fig. 125-4B). The two-compartment model also involves consideration of another aspect of drug distribution: The rate of distribution of drug from the central to the final volume of distribution is quantified by the distribution half-life (αt1/2), although some of the decline in plasma drug concentration during this period often is due to simultaneous drug elimination during the initial distribution phase. The elimination half-life (βt1/2) corresponds to the half-life considered using a single-compartment approach.
FIGURE 125-3
Schematic representation of a two-compartment pharmacokinetic model. A variable fraction (F, bioavailability) of administered dose (D) reaches the systemic circulation and is then distributed. Initial distribution occurs into the vascular space and rapidly perfused tissues, comprising the central or initial compartment (Vdc). Subsequently, further distribution into the peripheral or tissue compartment (VdT) occurs, at a rate quantified by the distribution half-life (αt1/2). During and after the initial distribution period, drug is eliminated by metabolism and/or excretion. Following complete distribution to VdT, the rate of plasma drug concentration decline is quantified by the terminal or elimination half-life (βt1/2), which is directly proportional to VdT and inversely proportional to clearance (CL).
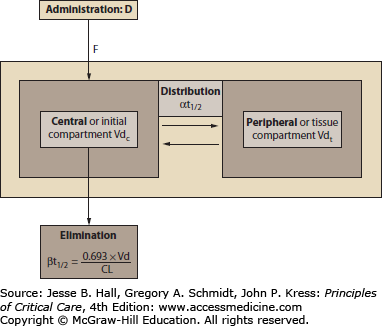
FIGURE 125-4
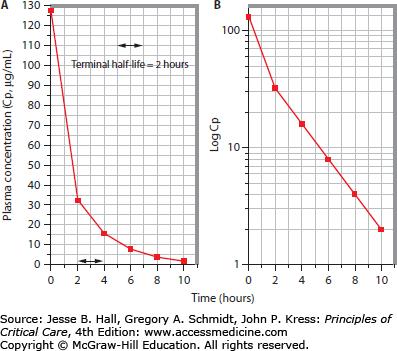
Linear pharmacokinetic profile with a two-compartment model. A. When earlier plasma samples are obtained following repetition of the same drug administration procedure described in Figure 125-1, it is apparent that in fact this drug is distributed into two compartments rather than a single space. The earliest plasma sample, obtained immediately after administration of the drug bolus, contains 128 µg/mL (Cp0) of the drug; the initial volume of distribution is thus 6.25 L or 0.0625 L/kg. By 2 hours postinjection this has declined to 32 µg/mL, as found in the Figure 125-1 protocol; subsequently the plasma concentration declines as in Figure 125-1. B. Log transformation of the plasma concentration values now reveals multiexponential kinetics, with two distinct slopes, indicating a more rapid early decline owing to a combination of drug distribution and simultaneous elimination, followed by a second phase owing to elimination only (postdistribution).
Despite these refinements, the principles of linear pharmacokinetics hold for most agents in practice. Thus from a semilog plot [log concentration (y) vs time (x)], the slope is ke (the elimination rate constant) following full distribution (Vdtot), and the rate of drug clearance (CL) is based on the balance of distribution and excretion rates:
It is often incorrectly assumed that CL may be calculated from this equation. In fact, both CL and Vdtot are quantified to determine ke. In other words, CL and Vdtot determine ke: CL is a physiologic value, a measurement of the volume of plasma from which a substance is completely cleared per unit time (in units of volume per unit time, usually milliliters per minute); Vdtot is a theoretical volume determined by a postdistribution plasma concentration measurement; thus ke is a derived variable, and the rate of elimination may thus be considered to reflect the balance of drug distribution to tissues and drug elimination from the body,9 so that it is useful to consider this relationship as follows:
and, since
In other words, the elimination half-life of drug is prolonged by a large volume of distribution or low clearance value, and shortened by limited distribution or a vigorous clearance process.6 The measured clearance of a substance (CLTOT) usually represents the algebraic sum of several clearance processes; in many cases, this may be represented as follows:
For most drugs, it is appropriate to consider the magnitude of each of these component processes and the effects of the altered physiology of critical illness on their relative importance in achieving clearance of parent drug and metabolites. Clearance of any agent by an eliminating organ is proportional to, but cannot exceed, blood flow to the eliminating organ: CL = Q × (CA − CV), where Q is organ blood flow, and CA and CV are the drug concentrations in the arterial and venous blood supplies to the eliminating organ, respectively. These and other PK parameters relevant to the individualization of critical care drug therapeutics will be discussed below.
It is a basic tenet of the above approach that pharmacologic response is proportional to plasma drug concentration. Four additional determinants of pharmacologic response merit emphasis in this regard: (1) the “effect site” concept, (2) the importance of the free (unbound) plasma drug concentration, (3) interindividual variability in drug response, and (4) dose-dependent alterations in receptor activation and pharmacologic effect.
Effect Site: The effect site concept was introduced to more completely describe the relationship of drug disposition to pharmacologic response. This term refers to the tissue compartment containing the receptors that must be bound in order to elicit drug effect.10 If the effect site is located in a rapidly perfused compartment (Vdc), then intravenous drug administration will elicit immediate pharmacologic response. The antiarrhythmic effect of lidocaine is an example of such behavior, and thus initial serum lidocaine levels correlate directly with drug effect. In fact, the well-established practice of empirically administering additional lidocaine boluses following an initial load is based on the necessity of maintaining adequate serum levels, which tend to decline as the drug distributes into other tissues or is eliminated.3,11 The distribution half-life (αt1/2) of lidocaine is only 8 minutes (see Fig. 125-3), so the plasma level following an initial bolus may decline to subtherapeutic levels before a simultaneously administered continuous infusion results in drug accumulation sufficient to attain the desired steady-state plasma level (Cpss). By contrast, plasma digoxin levels do not correlate with drug effect until the postdistribution phase (2 to 4 hours following an IV bolus), because distribution to tissues is required for binding to the target tissue receptors. The usual total digoxin loading dose of 1 mg is generally administered in smaller fractions (typically 0.5 mg first, with 0.25 mg following at 6 and 12 hours later), because the full effects of each loading dose fraction cannot be assessed until tissue distribution has occurred, at which time the loading procedure can continue, if it is necessary and safe to do so.
Free or Unbound Plasma Drug Concentration: Only free (unbound) drug is available for receptor binding, so that alterations in plasma protein binding may affect the interpretability of measured total (free plus bound) plasma drug concentrations profoundly. For example, plasma protein binding of phenytoin is diminished by either hypoalbuminemia or uremia, the former owing to lesser absolute availability of albumin binding sites, and the latter thought to be a result of competitive occupancy of these sites by “uremic substances.” As a result of this phenomenon, total plasma phenytoin concentrations are often misleading in such patients. Phenytoin is normally 90% plasma protein bound, so that the usual total plasma concentration range is 10 to 20 mg/L, and the free level is 1 to 2 mg/L. If plasma albumin is decreased from 4 g/dL to 2 g/dL, then an apparently therapeutic total plasma phenytoin level of 16 mg/L may be associated with a toxic free phenytoin level of over 7 mg/L; this is because the unbound or free fraction increases from the customary 10% toward 50%. It is therefore wise to monitor free rather than total phenytoin plasma levels, particularly in patients with hypoalbuminemia or renal insufficiency.
Interindividual Response Variability (Sensitivity): Another point to note is the variability between individual responses to a given plasma drug level; sensitivity to drug action may differ between individuals or groups. For example, elderly subjects are more sensitive to the sedative effects of benzodiazepines (and many other sedatives) than younger subjects12; American subjects of Chinese descent are twice as sensitive as American white men to the β-blocking effects of propranolol13; black subjects are less sensitive to the vasodilatory effect of isoproterenol than are white Americans.14 Recent evidence implicates pharmacogenomics as the cause of variability of drug effect between races, and even individuals within races.15 Pharmacogenomics is the study of the role of inherited and acquired genetic variation in drug response. It can facilitate the identification of biomarkers that can help physicians optimize drug selection, dose, and treatment duration and avert adverse drug reactions.16 An example is an association between the presence of HLA-B*5701 and hypersensitivity reactions to Abacavir, a nucleoside analogue used to treat HIV infection.17 This resulted in the FDA modification of the abacavir label to include a recommendation that patients undergo genotyping for HLA-B*5701 before the initiation of therapy. Despite significant advances in research relating to pharmacogenomics as well as FDA guidelines, the use of these tests is not widespread due to limitations in the availability of tests, lack of cost-effective analyses, and the need to establish clinical utility. Current information regarding the known specific drug gene interactions can be obtained through the National Institute of Health Pharmacogenetics Research Network’s PharmGKB: The Pharmacogenomics Knowledge base (www.pharmgkb.org).18
Dose-Dependent Effects: The predominant drug-receptor complex mediating a drug’s effect may change according to drug concentration, resulting in variable pharmacologic responses at different plasma levels. For example, dopamine predominantly activates dopaminergic receptors (and causes mesenteric and renal vasodilation) only at infusion rates of up to 2 µg/kg per minute. β1-Adrenergic (inotropic) and α-adrenergic (vasoconstrictor) activation occur at doses as low as 2 to 4 µg/kg per minute and 5 to 10 µg/kg per minute, respectively; as a result, the hemodynamic effect of dopamine infusion changes with increasing dose.15 Despite such concerns, we expect the attainment of drug levels in the usual therapeutic range to elicit the desired effect in most patients.
Most drugs used in the ICU are dosed according to broadly applicable population-based PK and PD parameters and titrated to pharmacologic response only if this is readily quantifiable, rather than being subjected to rigorous PK modeling with therapeutic drug-level monitoring. The latter approach is applied to drugs that have a low therapeutic index and plasma drug concentrations that correlate with drug effect. The intermediate-complexity approach of monitoring physiologic parameters (PD monitoring) of drug effect is more readily applied in the ICU (and operating room) than in other patient care settings because of the routine use of monitoring devices. Sedation, neuromuscular paralysis, seizure suppression, diuretic agent action, and the effects of cardiovascular drugs (antiarrhythmic, chronotropic, inotropic, vasodilator, and vasoconstrictor actions) and bronchodilators are commonly assessed in this fashion, in conjunction with formal PK monitoring using drug levels for appropriate agents.
What follows is a framework for drug administration based on physiologic modeling of the patient and application of known drug characteristics to this patient model, in order to optimize ICU therapeutics and minimize the potential for iatrogenic adverse events. Furthermore, this approach includes routine surveillance to prevent adverse drug reactions, and to assess the potential for such a phenomenon to be the underlying cause of a change in patient status.
INDIVIDUALIZATION OF DRUG THERAPY IN THE ICU: AN APPROACH TO RATIONAL DRUG DOSING IN CRITICALLY ILL PATIENTS
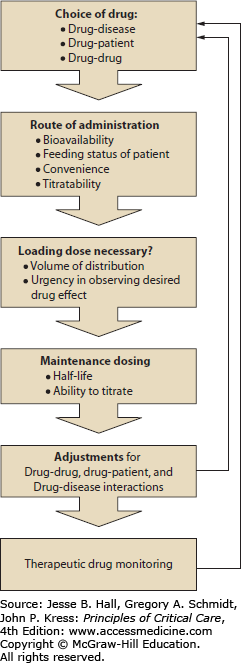
The PK and PD principles outlined above may be applied routinely to attempt optimal design of drug regimens for ICU patients. As shown in Figure 125-5, focused consideration of PK and PD parameters to answer a series of questions can provide a framework for therapeutic individualization. Individualization of drug therapy requires consideration of the effects of multiple factors responsible for variability in drug response (aside from disease severity); these include (1) drug-patient interactions (including body habitus, age, gender, comorbidities, and race) and (2) drug-drug interactions. This approach only yields an approximation of ideal therapeutics, because information addressing drug disposition in this population is often incomplete, and its interpretation is further complicated by the dynamic physiology of critical illness. This method simply attempts to maximize the potential for rational therapy based on available information. As a result, any drug regimen in critically ill patients requires early and frequent reassessment. The customary prudent approach to drug dosing in settings in which altered disposition is anticipated but poorly quantifiable, embodied in the phrase “start low and go slow,” is generally inappropriate in this setting, in which immediate therapeutic effect may be vital. Nevertheless, a rational approach to critical care therapeutics should reduce the incidence of iatrogenic pharmacotherapeutic complications of critical illness.
FIGURE 125-5
Flowchart for a suggested method of design for a rational drug dosing regimen. This illustration serves to depict the process of drug prescription and dosing as a perpetual cycle of actions. Individualization of drug therapy involves careful consideration of the patient’s unique clinical status for each step along the path of drug prescription and dosing. The initial choice of drug, route of administration, loading dose, and maintenance dose calculations involve consideration of desired drug effects, titratability, and convenience. Modifications of the dosing regimen may be required to accommodate the individual characteristics of the patient, including allergies, age, sex, and race; potential drug-drug interactions; and potentially confounding disease states. Once a drug regimen is designed and implemented, therapeutic drug monitoring is indicated to ensure adequate drug effect and to minimize potential adverse events. The results of therapeutic drug monitoring may indicate the need for further modification of the drug regimen.
The key principles underlying this approach, which relates PK parameters to choices of drug regimen, may be summarized as follows:
The appropriate loading dose is determined by estimation of the volume of distribution of the agent in the patient; the regimen for administering this dose is chosen based on the desired effect site and the distribution half-life for the agent.
The maintenance dose is chosen to equal the elimination rate of the agent at steady state (the product of CL × Cpss).
Steady-state plasma drug level and stable drug effect are not obtained until three to five half-lives (see Table 125-2 and Fig. 125-2) have passed.
Many adverse drug reactions are predictable and preventable by individualization of therapeutics and by consideration of known or potential drug interactions.
Patient characteristics are used to estimate physiologic and pathophysiologic variables affecting drug disposition. Several patient characteristics should be routinely considered, including age, gender, drug allergies, body habitus, volume status, plasma protein concentrations, and parameters of organ function (gastrointestinal tract, circulatory, renal, and liver function).
Age, gender, body habitus, and volume status are variables used to estimate expected parameters of drug disposition, based on population PK/PD data. For most dosing calculations, the lesser of lean (or ideal) and actual body weight is used. Lean body weight (LBW) is calculated from the patient’s height: For males, LBW (kg) = 50 + (2.3 × each inch above 5 feet). For females, LBW (kg) = 45.5 + (2.3 × each inch above feet). Some drugs are dosed according to actual weight or to patient body surface area, the latter obtainable from published nomograms using height and weight.
Using these data, we approach the design of individualized drug therapy for ICU patients as follows:
Oral bioavailability of the agent may be inadequate to achieve systemic effect owing to luminal conditions (alkaline pH or tube feeds) or first-pass metabolism (by luminal bacteria, intestinal enzymes, or hepatic enzymes). Intravenous drug administration is often preferred in the ICU, even for administration of highly bioavailable drugs, for several reasons. Rapid onset and offset of effect may be desirable to rapidly initiate therapy, while retaining the capacity for titration. Acute decompensated heart failure and cirrhosis will reduce oral bioavailability due to bowel edema and impaired intestinal perfusion. A less appreciated cause of reduced absorption is intestinal atrophy with associated decreased surface area and cellular enzyme activity which can occur as a result of as little as 3 days of reduced enteral feeding.19 Formulation properties (eg, extended-release preparations) do not affect the extent of absorption, but rather the rate of absorption and potentially the peak drug concentration after each dose.
Many therapies initiated in the ICU are intended to have a rapid onset of effect. Whether administered by continuous intravenous infusion, intermittent intravenous bolus, or oral dosing, plasma drug concentration and therapeutic effect will not reach steady-state levels until three to five half-lives have passed; such a delay may be unacceptable, particularly for drugs that have a prolonged half-life (which may be a normal feature of a drug’s disposition [eg, digoxin], or caused by organ dysfunction and impaired elimination [eg, aminoglycosides with renal failure]). Conversely, drugs that have a very short half-life (eg, nitrovasodilators, esmolol, atracurium, and propofol) may achieve a rapid therapeutic effect when administered by infusion but without a loading bolus, since three to five half-lives pass in a matter of minutes. Administration of a loading dose, calculated as follows, rapidly achieves the desired target level (but does not alter the time required to attain steady-state conditions):
where Cp is the desired plasma concentration.
The appropriate loading dose is primarily determined by the distribution characteristics of the drug (Vd) and the body habitus and volume status of the patient. Usual volume of distribution values are readily available for most drugs; however, the effects of alterations in body habitus, nutrition, and volume status are much more difficult to quantify. Estimates of drug distribution characteristics are further confounded in critically ill patients by dynamic hypercatabolic losses of fat and lean body mass, accompanied by massive third-space volume retention or intravascular volume depletion, often associated with development of hypoalbuminemia and relative hyperglobulinemia. Following a period of marked positive fluid balance in a hospitalized patient, the weight increment may be used to estimate the total body water increase. Otherwise, estimates of altered body water content are usually empiric, although therapeutics in some specific disease states have been studied in sufficient detail to provide useful information. For example, a decreased aminoglycoside loading dose is required in volume-depleted acute renal failure. Furthermore, “uremic substances” that accumulate in renal failure appear to displace some drugs from tissue-binding sites, thus reducing their Vd regardless of volume status. As a result, the appropriate digoxin loading dose is decreased by 50% in the presence of renal failure; Vd is also decreased for methotrexate and insulin in renal failure patients. Reduced Vd may be seen with older age and volume depletion from vomiting, diarrhea, blood loss, and diuretics. Increased drug Vd often develops from early goal-directed therapy for sepsis, edematous states, such as cirrhosis and acute hepatic failure, nephritic syndrome, right and left heart failure, and many illnesses associated with shock requiring aggressive volume repletion to maximize end organ perfusion.19 The Vd of many drugs is increased in patients with moderate to severe chronic kidney disease (CKD) as well as in those with preexisting CKD who develop AKI. If the Vd of a drug is significantly increased in CKD patients, a loading dose will likely be needed even if one was not routinely recommended for those with normal renal function.20
Determination of the ideal or lean body weight is difficult in the presence of obesity, cachexia, or combinations of the above factors, such as in a typical hypercatabolic patient with sepsis, acute renal failure, and postresuscitation volume overload. Loading dose regimens may also be altered based on the relationship between the desired onset of effect to the distribution pattern at the effect site, as discussed above in contrasting the standard loading dose regimens for lidocaine and digoxin.
Volume of distribution for a given drug is reported in units of volume per weight in a normal patient. In the critically ill patient, the alterations in weight and body fluid compartments will alter the distribution of the drug. A reasonable approach to approximate these alterations in the calculation of the loading dose of hydrophilic drugs is to adjust the normal volume of distribution in proportion to the estimation of the patient’s water compartment. It is reasonable to assume that water comprises approximately 10% of adipose tissue weight (estimated as actual body weight minus lean body weight). In addition, the net weight gain secondary to fluid resuscitation will contribute to the volume of distribution for water-soluble drugs. Mathematically, we can express this by the following:
Administration Regimen: In the critical care setting, the administration regimen usually consists of a choice between intermittent intravenous bolus therapy and continuous intravenous infusion. Factors considered in this decision include drug characteristics (half-life and therapeutic index), patient characteristics, the desired pharmacologic effect, and cost/staffing considerations. When drugs with a low therapeutic index are dosed intermittently, the fluctuations (peak-to-trough) of plasma concentration may require formal monitoring of plasma concentrations and PK parameter estimates to ensure adequate therapy without toxicity. Administration by infusion eliminates the peak-to-trough plasma concentration fluctuations associated with intermittent parenteral boluses, which may be accompanied not only by failure to achieve continuous therapeutic effect, but also by activation of rebound counterregulatory effects during trough periods (negating prior and subsequent drug action). Continuous intravenous infusion may thus improve therapeutic efficacy of some agents. Loop diuretic agent infusions have been reported to augment sodium excretion compared to equivalent intermittent dosing, probably because of a combination of effects: increased cumulative renal tubular diuretic agent exposure (the product of time and concentration) and avoidance of periods of physiologic rebound salt conservation.22,23 Since diuretic effect onset is delayed when using only continuous intravenous infusion (until drug accumulates; see Fig. 125-2), the ideal regimen to maximize natriuresis may include an initial bolus dose to achieve the required luminal threshold drug concentration and induce immediate natriuresis.
Continuous infusion of short-acting agents may also be desirable to allow titration of effect; nitrovasodilators, esmolol, propofol, and atracurium may be used for optimal control of vasodilation, β-blockade, sedation, or neuromuscular paralysis, respectively. It is widely assumed that continuous infusion of agents that have a short elimination half-life guarantees rapid reversal of drug effect following cessation of the infusion, but various factors may retard offset of effect, as is the case for reversal of sedation using agents administered by continuous infusion.24,25 Potential explanations for such alterations in drug disposition or response during continuous infusion compared to intermittent bolus therapy include compartmentalized tissue distribution, accumulation of active metabolites, or saturation of clearance mechanisms. Intermittent bolus administration titrated to specific sedation parameters is less likely than continuous infusion to result in undetected drug or metabolite accumulation if excretory mechanisms deteriorate or become saturated, unless a routine assessment of time to awakening is performed daily in patients receiving continuous infusion. Clinically, it has been shown that daily interruption of sedation of mechanically ventilated patients results in decreased duration of ventilation, likely due to the minimization of drug accumulation.26 Conversely, tolerance to the effects of several drugs (a pharmacodynamic phenomenon) occurs if a drug-free interval cannot be included in the administration regimen, requiring escalating dosages of agents such as nitroglycerin, dobutamine, and opiate analgesics to maintain a therapeutic effect. Finally, the convenience for nursing staff of administering agents by continuous infusion rather than intermittent bolus translates into decreased staffing expenditures.
Clearance: Clearance includes all processes that eliminate the drug from the body—both excretion and biotransformation. Because the total body clearance of a drug involves the actions of multiple organ systems, the estimation of the predominant rate of elimination and route of elimination is often complicated, and warrants further discussion.
What is the predicted elimination rate of the drug?
The predicted elimination of the drug usually corresponds to the drug administration regimen that elicits an optimal therapeutic response in most subjects. Agents with a low therapeutic index may be subjected to therapeutic drug monitoring, aiming for a maintenance dose equaling the product of CL × Cpss. The desired Cpss is selected based on the therapeutic response required (eg, target plasma lidocaine level for suppression of ventricular arrhythmias) and the clearance rate is estimated based on published data (usually obtained from healthy patients). At steady state, the rate of administration (Ra) equals the rate of excretion (Re). Ra is dose (mg) divided by interval (minutes), and Re is CL (mL/min) × Cpss (mg/mL).
What are the predominant routes of elimination of the parent drug and its metabolites (particularly those that are pharmacologically active or toxic)?
Renal insufficiency (Table 125-3), hepatic disease (Table 125-4), or circulatory dysfunction (Table 125-5) may affect clearance of parent drug or metabolites. There are several well-known examples of drugs with metabolites that are pharmacologically active or even toxic. Accumulation of active or toxic metabolites in the presence of renal failure is probably the most common clinical scenario in which this feature of drug disposition is important (Table 125-6). Nonrenal (usually hepatic) elimination of parent drug or metabolites has been increasingly documented to be quantitatively important in subjects with renal impairment (as discussed below). Likewise, renal drug or metabolite elimination assumes an increased role in subjects with liver disease.
Is a dose reduction or escalation required, owing to impaired (renal, hepatic, or circulatory dysfunction) or augmented (induction of metabolism or extracorporeal drug removal) clearance of the drug or its metabolites?
As outlined below, glomerular filtration rate (GFR) may be estimated routinely to a reasonable approximation, and the effects of renal dysfunction on drug clearance may be estimated with some degree of precision (see Table 125-3). The effects of varying levels and etiologies of hepatic and circulatory dysfunction (see Tables 125-4 and 125-5) on drug disposition are far more difficult to predict. Estimation of renal and hepatic clearance functions and factors that alter drug metabolism and excretion will be further discussed below. Biliary, pulmonary, cutaneous, and extracorporeal elimination may be important for clearance of some specific agents and will not be discussed in detail here. For further information regarding drug clearance by extracorporeal devices, see Chap. 124; as a general rule, an increase in drug clearance by 30% or more is regarded as significant. Dialyzability by hemodialysis (HD) or peritoneal dialysis is suggested by water solubility, low molecular weight (<500 Da; up to 20000 Da with high-flux membranes), low protein binding (<90%), small volume of distribution (Vd <1 L/kg), and a low intrinsic clearance (<500 mL/70 kg per minute).3,20 HD clearance is additionally affected by the porosity and surface area of the membrane used, and the blood pump and dialysate flow rates. Drug clearance by hemofiltration (slow continuous ultrafiltration, continuous arteriovenous hemofiltration, or continuous venovenous hemofiltration) may be achieved by either transmembrane sieving (convection) or membrane drug adsorption (eg, it requires 20 mg of aminoglycosides such as gentamicin or tobramycin, which are polycationic, to saturate each new AN69 hemofilter, which is anionic); the addition of diffusive clearance by use of countercurrent dialysate flow (continuous arteriovenous hemodiafiltration or continuous venovenous hemodiafiltration) augments small-solute clearance (since the capacity of these substances to cross the membrane is limited by the concentration gradient, not particle size). Data regarding altered drug disposition (changes in Vd or clearance) induced by extracorporeal membrane oxygenation (ECMO) or plasmapheresis are available only for agents that have been specifically studied (eg, aminoglycosides, opiates, and phenytoin), and in the case of ECMO, studies have been performed almost exclusively in pediatric patient populations. The impact of HD is not strictly limited to dialysis clearance. Recent findings suggest that the nonrenal clearance of some agents is altered by HD. A study of midazolam in subjects with end-stage renal disease implicated transporters (human organic anion-transporting polypeptide and/or intestinal P-glycoprotein) as the likely drug disposition bottleneck in uremia rather than CYP3A4.20
Effects of Renal Failure on Drug Disposition and Effect
| Bioavailability |
| Absorption of specific drugs may be impaired by increased gastric pH (because of gastric urease–produced ammonia), chelation by orally administered phosphate-binding agents, or by bowel wall edema. Conversely, bioavailability may be increased by uremia-induced impairment of first-pass metabolism. Uremic effects on intestinal motility (ileus) affect the rate, rather than the extent, of drug absorption, unless emesis result in loss of ingested drug. |
| Protein binding |
| Binding of acidic drugs to albumin is decreased, because of competition with accumulated organic acids, and because of uremia-induced structural changes in albumin, which decrease drug-binding affinity (eg, barbiturates, cephalosporins,. penicillins, phenytoin, salicylate, sulfonamides, valproate, warfarin). |
| Volume of distribution |
| Vd may be altered in the presence of renal failure. Drugs that are acidic, are highly protein bound, and have a small volume of distribution are likely to be significantly affected. Other drugs may also be affected (eg, aminoglycosides [volume status effects]), digoxin (displacement from tissue sites by [“uremic substances”]). |
| Biotransformation |
| Nonrenal (ie, hepatic) clearance may be impaired. This phenomenon is best characterized in chronic renal insufficiency (rather than acute renal failure), affecting oxidative metabolism (phase I enzymes). Conversely, phenytoin clearance is augmented. |
| Excretion |
| Drugs that are more than 30% eliminated unchanged in the urine are likely to have significantly diminished CL in the presence of renal insufficiency. This results in a prolonged half-life for elimination of drugs such as digoxin, aminoglycosides, insulin, and others. The renal excretory route may assume increased importance in clearance of some drugs in the presence of hepatic impairment. Other drugs have toxic or active metabolites requiring renal elimination (Table 125-6). If dialysis or hemofiltration is required, drug removal may be significant. |
| Pharmacodynamic effects |
| Some drugs, such as sedative agents, may have enhanced effect in combination with the uremic milieu. Electrolyte abnormalities and acidosis may alter effects of drugs such as antiarrhythmic agents. |
Effects of Liver Dysfunction on Drug Disposition and Effect
| Bioavailability |
| Drugs that undergo extensive first-pass metabolism may have a significantly higher oral bioavailability in cirrhotics than in normal subjects. Impaired drug absorption because of bowel wall edema has not been found in studies of cirrhotic subjects. GI hypomotility may delay peak response to enterally administered drugs in these patients. |
| Protein binding |


