Cardiovascular Physiology
Peter E. Oishi
Rebecca J. Kameny
Julien I. Hoffman
Jeffrey R. Fineman
KEY POINTS
 Cardiovascular physiology is based on principles of hydrodynamics and fluid mechanics. Although the cardiovascular system does not conform precisely to simple physical models, a basic understanding of hemodynamic principles is essential in the care of critically ill patients with cardiovascular derangements.
Hemodynamic Principles
 When Poiseuille’s Law is applied, the resistance to flow is determined solely by the dimensions of the vessel and the viscosity of the fluid. Thus, in the cardiovascular system with constant blood viscosity, dynamic vascular resistance is mediated by vasoconstriction and vasodilation. Exceptions include alterations in surrounding pressure, such as compression of intra-alveolar capillaries with lung overdistension.
 Precapillary arterioles (or equivalent vessels) are the site of maximal resistance in the cardiovascular circuit.
Interactions of the Cardiac Pump and Vasculature
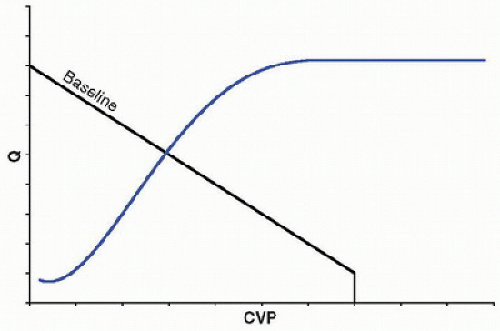
 The vascular function curve describes how changes in cardiac output affect central venous pressure (CVP), or venous return.
 Critical closing pressure (Pcc) represents the lowest possible CVP and highest possible flow (Q) for any given blood volume.
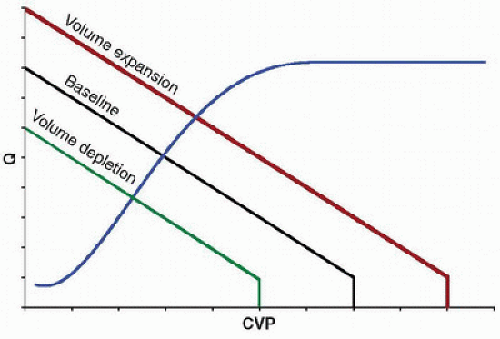
 The vascular function curve is affected by blood volume, undergoing a right shift with expansion of the circulating volume (e.g., transfusion) and left shift with volume depletion (e.g., hemorrhage).
 The cardiac function curve is the reverse of the vascular function curve—it examines how changes in CVP affect Q.
 At any given time, the cardiovascular system operates at one theoretical point of intersection between the vascular and cardiac function curves.
 Pressure-volume loops provide information about total stroke work, myocardial efficiency, inotropic status of the heart, and diastolic function. Understanding alterations that occur in various disease states can help guide clinical management.
Regulation of Vascular Resistance
 Vascular endothelial cells produce factors, which interact with vascular smooth muscle cells to cause relaxation or contraction—and thus regulate dynamic changes in vascular resistance.
Fetal Circulation and Transition to Postnatal Life
 In the fetus, the right ventricle supplies most of its blood via the ductus arteriosus and descending aorta to the placenta for oxygen uptake, and the left ventricle supplies most its blood to the brain and heart for oxygen delivery. Critical shunts within the fetal circulation enable this process.
Regulation of Select Regional Circulations
 The pulmonary vasculature is actively maintained in a dilated, low-resistance state. Alterations in this process are central to the pathophysiology of a number of pulmonary vascular disorders and can severely impact overall cardiovascular performance.
 Hypoxic pulmonary vasoconstriction is an essential and unique feature of the pulmonary vasculature, as it allows for the matching of ventilation and perfusion.
 The exact mechanism of pH-mediated pulmonary vascular reactivity is incompletely understood, but appears to be independent of PaCO2.
 West zones of the lung describe the relationship between pulmonary artery pressure, alveolar pressure, and pulmonary venous pressure. In addition to the three zones typically described (see text), an additional zone IV has been described in which pulmonary blood flow decreases at the extreme base (dependent portion) of the lung.
 Alterations in coronary blood flow support cardiac work in a manner that allows myocardial performance (oxygen delivery) to match the overall needs (oxygen demand) of the entire body.
The chief function of the cardiovascular system is to deliver essential products to the tissues in order to maintain normal metabolic function and to remove metabolic waste products from them. Derangements in normal cardiovascular function are integral to the pathophysiology of a wide array of critical disease processes in children. In addition, many therapies employed in the intensive care setting directly or indirectly impact the cardiovascular system in ways that may either improve or impede its function. Complicating matters further, components within the cardiovascular system may be differentially or diametrically affected by specific therapies, requiring practitioners to reconcile these varying responses.
This chapter contains a review of the fundamental hemodynamic principles that govern flow through the circulation and measurements of cardiac performance, an examination of the basic mechanisms that regulate vascular tone, and a review of some specific regional circulations in detail. In addition, the special circumstance of the fetal circulation and the perinatal transition are reviewed. An understanding of these concepts should assist the intensivist in caring for patients with cardiovascular compromise and in arbitrating the various needs of the regional circulations.
THE CARDIOVASCULAR CIRCUIT AND VASCULAR ANATOMY
The cardiovascular system is composed of a pump and a large network of tubes that carry blood with all of its metabolic substances to and away from the tissues. The pump is the heart, which is actually two pumps in series: the right ventricle (RV) pumps blood through the pulmonary circulation, and the left ventricle (LV) pumps blood through the systemic circulation. The tubes are the arteries, arterioles, capillaries, venules, and veins that have differing anatomic compositions depending on  their location and function within the circulation. Much of our understanding of cardiovascular physiology is based on principles of hydrodynamics and fluid mechanics. Although the cardiovascular system does not conform precisely to simple physical models, a basic understanding of hemodynamic principles is essential in the care of critically ill patients with cardiovascular derangements.
 their location and function within the circulation. Much of our understanding of cardiovascular physiology is based on principles of hydrodynamics and fluid mechanics. Although the cardiovascular system does not conform precisely to simple physical models, a basic understanding of hemodynamic principles is essential in the care of critically ill patients with cardiovascular derangements.
HEMODYNAMIC PRINCIPLES
Flow, Velocity, and Cross-Sectional Area
The velocity of blood flow through a segment of the circulation has units of distance and time (e.g., centimeters/second). The flow of blood through the circulation has units of volume and time (e.g., liters/minute). At a constant flow, the velocity of blood through a vessel relates to the cross-sectional area of the vessel, expressed by the equation:
v = Q/A
where v is velocity, Q is flow, and A is the cross-sectional area.
Therefore, velocity is proportional to flow and inversely proportional to the cross-sectional area. Thus, peak velocity occurs in the aorta and reaches its nadir in the capillary beds, which have tremendous cross-sectional areas. Velocity increases again as blood moves from the capillaries toward the central veins.
Pressure, Flow, and Resistance
The primary determinants of flow (Q) through a vascular segment are the inflow pressure (Pi), the outflow pressure (Po), and the vascular resistance (R). For Newtonian fluids moving with laminar flow through cylindrical tubes, the relationship of flow to various physical factors can be expressed by Poiseuille’s Law, which is:
where r is radius, η is viscosity, and l is length.
Thus, flow through a vessel will increase as the pressure difference across the vessel increases. Furthermore, as the diameter of the vessel increases, so too will flow at any given pressure difference (Pi – Po). Conversely, increases in viscosity and vessel length result in a decrease in flow.
Alterations in blood vessel diameter, resulting from changes in the contractile state of vascular smooth muscle, are central to regulating blood flow, particularly in the regional vascular beds. The relationship of pressure and flow to resistance can be understood by examining the hydraulic equivalent of Ohm’s Law:

which states that the resistance to flow through a vessel is equivalent to the change in pressure across the vessel divided by the flow through the vessel. For Newtonian fluids moving through cylindrical tubes, this relationship can be expressed by a rearrangement of Poiseuille’s Law to give the hydraulic resistance equation:

 Therefore, when Poiseuille law is applied, the resistance to flow is determined solely by the dimensions of the vessel and the viscosity of the fluid. Moreover, since resistance changes with the fourth power of the radius, even small changes in vessel caliber resulting from vascular contraction or relaxation have a profound impact on flow through a vessel.
Studies indicate that pressure within the vasculature decreases  progressively from the aorta to the vena cava, with the largest drop at the level of the arterioles (1). Thus, it follows from the relationships above that resistance is greatest at the level of the arterioles if blood flow is constant through the circulation. How, then, do we reconcile this fact with the effect of vessel diameter on resistance, in that the internal diameter of a capillary is far less than an arteriole? These findings can be reconciled by understanding that capillary beds are vessels in parallel, while the arterial system feeding a particular capillary bed is in series. When calculating the resistance of a system composed of a set of resistors in series (e.g., aorta, large arteries, small arteries, and arterioles), the total resistance is equal to the sum of the individual resistances. Conversely, when calculating the resistance of a system composed of a set of resistors in parallel, such as a capillary network, the total resistance is equal to the sum of the reciprocals of the individual resistances (1/R). Thus, for a capillary network, the total resistance is less than the resistance in any individual capillary.
 progressively from the aorta to the vena cava, with the largest drop at the level of the arterioles (1). Thus, it follows from the relationships above that resistance is greatest at the level of the arterioles if blood flow is constant through the circulation. How, then, do we reconcile this fact with the effect of vessel diameter on resistance, in that the internal diameter of a capillary is far less than an arteriole? These findings can be reconciled by understanding that capillary beds are vessels in parallel, while the arterial system feeding a particular capillary bed is in series. When calculating the resistance of a system composed of a set of resistors in series (e.g., aorta, large arteries, small arteries, and arterioles), the total resistance is equal to the sum of the individual resistances. Conversely, when calculating the resistance of a system composed of a set of resistors in parallel, such as a capillary network, the total resistance is equal to the sum of the reciprocals of the individual resistances (1/R). Thus, for a capillary network, the total resistance is less than the resistance in any individual capillary.
In addition, organs may have a number of resistance vessels in parallel proximal to the capillary bed. These vessels may be patent or may be recruited with increased flow. Increased pulmonary blood flow that occurs with exercise, for example, is in part accommodated by the recruitment of vessels that were previously closed. Thus, an additional factor, k, which represents these recruited vessels, can be added to the resistance equation:

From this equation, it can be seen that an increase in k will reduce resistance. In addition, the loss of these vessels—that is, a reduction in k—that may occur with disease (such as the obliteration of distal pulmonary arteries in advanced pulmonary arterial hypertension or the occlusion of vessels by intravascular emboli) will result in increased resistance.
Finally, changes in pressure that occur in response to changes in flow and resistance can be expressed when Ohm law is rearranged as:
Pi = QR + Po
Thus, vascular inflow pressure may increase when vascular resistance, blood flow, or outflow pressure increases. These factors are not independent. Pressure may remain constant with increased blood flow because the increase in flow has caused vascular resistance to decrease, for example, by dilating or recruiting previously closed vessels; that is, if the product QR does not increase, neither will pressure.
Compliance
A change in intravascular pressure results in a proportional change in intravascular volume. The incremental change in volume (δV) per unit change in pressure (δP) defines the compliance (C) of a vessel, as indicated by the equation:
C = δV/δP
In addition, specific compliance can also be evaluated, since the implications of absolute volume changes are different between small and large structures. Specific compliance is calculated by dividing by the baseline volume, as in the equation:
When calculations are made in this way, comparisons can be made more easily between patients of different sizes. For example, right ventricular compliance is of concern in atrial septal defects, as it is only when right ventricular compliance increases that a left-to-right shunt can develop. In order to measure right ventricular compliance, allowances must be made for the base volume. The same principle applies to measuring compliance of the aorta, the vena cava, and other fluidfilled structures.
The walls of veins are thinner, less well organized, and  contain less elastic tissue than those of arteries, and thus are ˜20 times more compliant. As a result, most of the circulating blood volume at any one time resides in the venous system, and therapeutic volume expansion has a disproportionate effect on venous, as opposed to arterial, volume.
 contain less elastic tissue than those of arteries, and thus are ˜20 times more compliant. As a result, most of the circulating blood volume at any one time resides in the venous system, and therapeutic volume expansion has a disproportionate effect on venous, as opposed to arterial, volume.
Imprecision of Mathematical Models
The application of these mathematical relationships in the vasculature has important caveats. Blood is not a Newtonian fluid, although at normal hematocrits, this is probably of little consequence. The walls of small arteries are neither smooth nor straight; rather they branch, curve, and taper. Blood flow is pulsatile, so that additional energy (and therefore a higher pressure) is necessary to overcome inertia and to accelerate the blood at each ejection. Because of short distances between arterial branch points, laminar flow is unlikely in peripheral vascular beds, and viscous pressure losses would be greater than in a physical model. Arteries are also distensible, and continuously changing transvascular pressures alter their radii; therefore, pressure-flow relationships are not linear. Lastly, vascular beds are comprised of many blood vessels in parallel. These vessels are not all open all the time, and their radii vary. Despite these differences, the general principles of changes in physical factors, such as viscosity and radius, apply (2).
INTERACTION OF THE CARDIAC PUMP AND THE VASCULATURE
Cardiac output is determined by heart rate, contractility, preload, and afterload. The precise mechanisms relevant to the control of heart rate and contractility, which are properties directly related to the heart, are reviewed in Chapter 71. Preload and afterload are related to both the heart and properties of the vasculature. These interactions can be understood by examining the vascular function curve, the cardiac function curve (otherwise known as the Starling curve) and their interactions.
Vascular Function Curve
 The vascular function curve describes how changes in cardiac output affect central venous pressure (CVP), or venous return (Fig. 69.1). To understand this relationship, a conceptual model can be used to partition the circulation into components, including a pump, an arterial compartment with a given compliance (Ca), a resistor (which represents the resistance through the arterioles, capillaries, and venules), and a venous compartment with a given compliance (Cv) (Fig. 69.2). The pump displaces blood from the venous compartment into the arterial compartment at some rate (Q), which, in this model, is equivalent to the cardiac output. The compliance of the arterial compartment accommodates a portion of this volume before blood is propelled across the microvascular resistor into the venous compartment, which can accommodate a much larger volume than the arterial compartment owing to its greater compliance. Increases in Q will decrease the volume
 of blood that resides in the venous compartment and, hence, will decrease the pressure in the venous compartment, which is equivalent to the CVP. Conversely, decreases in Q will increase the volume of blood that resides in the venous compartment, which will increase CVP.
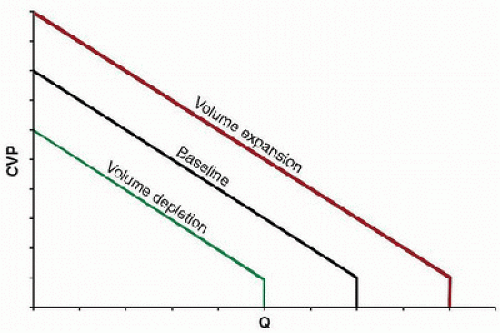 FIGURE 69.1. Vascular function curves shown at different intravascular volumes. The vascular function curve describes the effect of cardiac output (Q) on CVP, or venous return. Increases in Q decrease CVP, while decreases in Q increase CVP. Maximal Q occurs at the critical closing pressure of the venous circulation, whereby reductions in the volume of blood in the venous compartment are not possible, representing the lowest possible CVP and highest possible Q for any given blood volume (Pcc, critical closing pressure). At zero Q, the system reaches equilibrium, where pressures within the arterial and venous compartments are determined solely by compliance for any given blood volume. Volume expansion and depletion result in respective parallel increases and decreases in the vascular function curve. |
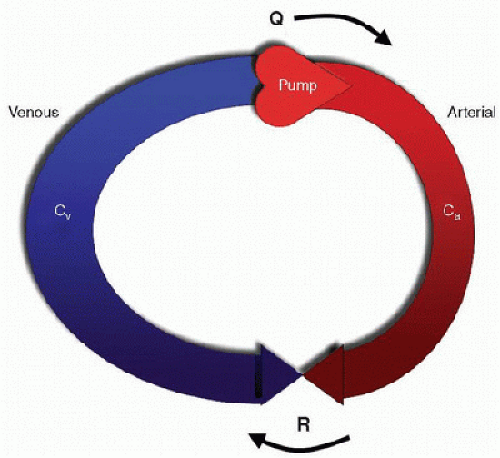 FIGURE 69.2. A conceptual model of the circulation. The circulation is partitioned into components, including a pump, an arterial compartment with compliance (Ca), a resistor (R), which represents the microvascular resistance of the arterioles, capillaries, and venules, and a venous compartment with compliance (Cv). The pump displaces blood from the venous compartment into the arterial compartment at rate (Q), which has units of volume and time (e.g., liters/minute). Increases in Q will decrease the volume of blood residing in the venous compartment and thus will decrease CVP. Conversely, decreases in Q will increase the volume of the venous compartment, which will increase CVP. CVP is determined by Q, R, and the ratio of Ca to Cv. As the compliance of the venous compartment is ˜20 times that of the arterial compartment, the venous compartment contains a larger volume than the arterial compartment under normal conditions. |
Important concepts can be seen at the extremes of the curve (Fig. 69.1). At some point, a maximal Q is achieved, whereby further reductions in the volume of blood in the venous compartment are not possible. Drawing blood from the venous compartment beyond this point would create a negative pres sure within the venous compartment, which would tend to collapse  the vessel walls. This point is termed the critical closing pressure (Pcc) and represents the lowest possible CVP and highest possible Q for any given blood volume. On the opposite extreme, when Q becomes zero, the system reaches a steady state, where pressures within the arterial and venous compartments are determined solely by compliance. In this situation,
  CVP would be at its maximum for any given blood volume. It is also important to note that the curve is affected by the blood volume, with parallel increases from baseline with expansion of the circulating volume (such that occur with blood transfusions) and decreases with volume depletion (such that occur with hemorrhage) (Fig. 69.1).
 the vessel walls. This point is termed the critical closing pressure (Pcc) and represents the lowest possible CVP and highest possible Q for any given blood volume. On the opposite extreme, when Q becomes zero, the system reaches a steady state, where pressures within the arterial and venous compartments are determined solely by compliance. In this situation,
  CVP would be at its maximum for any given blood volume. It is also important to note that the curve is affected by the blood volume, with parallel increases from baseline with expansion of the circulating volume (such that occur with blood transfusions) and decreases with volume depletion (such that occur with hemorrhage) (Fig. 69.1).
Cardiac Function Curve
 The cardiac function curve is the reverse of the vascular function curve. It examines, how changes in CVP affect Q (Fig. 69.3). This relationship is based on Starling law that describes increases in Q that result from augmented contractility due to increased stretch of the myocardium (see Chapter 71). On the steep portion of the curve, increases in CVP—through increased venous return—distend the RV (i.e., increased preload), which, in turn, augments right ventricular contractility and flow through the pulmonary circuit. This ultimately increases pulmonary venous return, which increases left ventricular preload and output. Although the cardiac function curve is directly related to CVP, it may also be affected by the other determinants of cardiac output, including afterload, contractility, and heart rate. For example, increases in systemic vascular resistance that increase afterload can result in a downward shift in the curve, whereas systemic vasodilation that decreases afterload shifts the curve upward (Fig. 69.3).
Interaction of Vascular and Cardiac Function Curves
At any given time, the cardiovascular system operates at one  theoretical point of intersection between the vascular and cardiac function curves (Fig. 69.4). Deviations from this point are transient. For example, according to the simplified model presented here, if the pump suddenly ejected an increased volume of blood, volume and pressure would increase in the arterial compartment and decrease in the venous compartment, which would transiently shift the vascular function curve to the left. According to the cardiac function curve, subsequent ejection would decrease, as CVP was reduced. Over a short period of time, this decrease in Q would result in an increase in CVP in accordance with the vascular function curve, returning the system to the initial point of intersection.
 theoretical point of intersection between the vascular and cardiac function curves (Fig. 69.4). Deviations from this point are transient. For example, according to the simplified model presented here, if the pump suddenly ejected an increased volume of blood, volume and pressure would increase in the arterial compartment and decrease in the venous compartment, which would transiently shift the vascular function curve to the left. According to the cardiac function curve, subsequent ejection would decrease, as CVP was reduced. Over a short period of time, this decrease in Q would result in an increase in CVP in accordance with the vascular function curve, returning the system to the initial point of intersection.
The superimposition of these curves in various physiologic states is useful, as it illustrates relationships between contractility, preload (including blood volume), and afterload. For example, Figure 69.5 shows that alterations in vascular resistance might shift both the vascular and cardiac function curves, whereas a single cardiac function curve can intersect with several vascular function curves with changes in blood
volume (Fig. 69.6). Furthermore, whereas alterations in blood volume result in parallel changes in the vascular function curve (Figs. 69.1 and 69.6), alterations in resistance alter the slope of the curve but not the CVP at zero Q, because this point depends only on blood volume and compliance (Fig. 69.5). As the cardiovascular system operates at the point of intersection between the two curves, alterations in blood volume will shift the operative state of the system, even though it does alter intrinsic cardiac function (Fig. 69.6). However, adding an inotrope could shift the cardiac function curve, which explains the common practice of fluid administration and inotropic support in the setting of shock. Indeed, critical illnesses with their attendant physiologic derangements will variably affect the cardiovascular system and may differentially affect the vascular and cardiac function curves. Likewise, therapies may also have differential effects. Thus, although the theoretical model described by the vascular and cardiac function curves is overly simplified, it is useful as a foundation with which to rationalize a therapeutic approach to various cardiovascular derangements.
volume (Fig. 69.6). Furthermore, whereas alterations in blood volume result in parallel changes in the vascular function curve (Figs. 69.1 and 69.6), alterations in resistance alter the slope of the curve but not the CVP at zero Q, because this point depends only on blood volume and compliance (Fig. 69.5). As the cardiovascular system operates at the point of intersection between the two curves, alterations in blood volume will shift the operative state of the system, even though it does alter intrinsic cardiac function (Fig. 69.6). However, adding an inotrope could shift the cardiac function curve, which explains the common practice of fluid administration and inotropic support in the setting of shock. Indeed, critical illnesses with their attendant physiologic derangements will variably affect the cardiovascular system and may differentially affect the vascular and cardiac function curves. Likewise, therapies may also have differential effects. Thus, although the theoretical model described by the vascular and cardiac function curves is overly simplified, it is useful as a foundation with which to rationalize a therapeutic approach to various cardiovascular derangements.
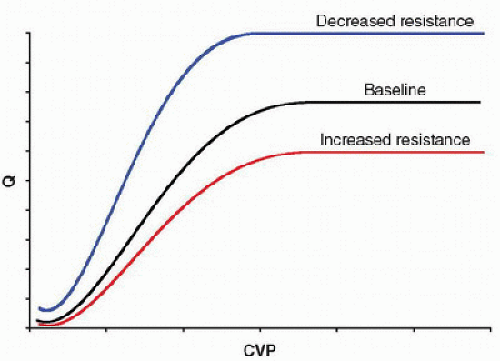 FIGURE 69.3. Cardiac function curves shown under conditions of varying degrees of systemic vascular resistance (afterload). The cardiac function curve describes how changes in CVP or venous return affect cardiac output (Q). On the steep portion of the curve, increases in CVP augment ventricular contractility. Increases in systemic vascular resistance (increased afterload) shift the curve downward, while decreases in systemic vascular resistance (decreased afterload) shift the curve upward. |
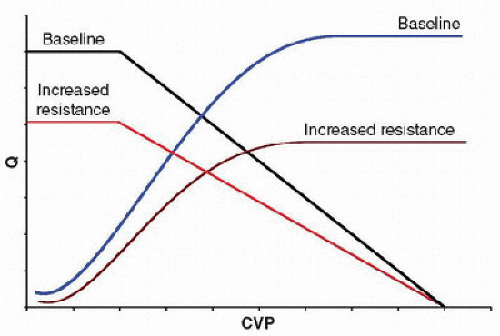 FIGURE 69.5. Effects of increased systemic vascular resistance on the vascular and cardiac function curves. Increased systemic vascular resistance (or afterload) shifts both curves downward, moving the operating state of the system that occurs at the point of intersection between the two curves downward. Increased systemic vascular resistance does not alter the vascular function curve at zero Q, as the CVP at this point is determined solely by the compliance of the venous compartment, at any given volume. |
Pressure-Volume Loops
The hemodynamic and mechanical events of the cardiac cycle in the LV can be graphically represented by the instantaneous relationship of pressure and volume (Fig. 69.7). In this diagram, end-diastole is represented by point A; this is also the point in the cardiac cycle when the mitral valve closes. From points A to B, the ventricle undergoes isovolumic contraction. At point B, the aortic valve opens, and there is ejection with relatively little decrease in pressure until aortic valve closure (point C). Point C also represents end-systole. Then, diastole begins with isovolumic relaxation until point D, which represents mitral valve opening. From points D to A, there is filling of the ventricle.
By imposing a change in preload or afterload without altering cardiac contractility (e.g., transient vena caval occlusion or phenylephrine administration), an informative series of pressure-volume loops can be generated (Fig. 69.8). The end-systolic points of this family of loops will have a linear relationship, which defines the end-systolic pressure-volume relationship (ESPVR). The slope of this line is Ees, a loadindependent index of the inotropic state of the myocardium. Interventions that affect inotropy (e.g., increase with epinephrine infusion or decrease with acute β-blockade) will alter the slope of the ESPVR. Thus, the ventricle has a different Ees for any given contractile state (Fig. 69.9); note that changes in inotropy (Ees) dramatically affect stroke volume at the same end-systolic pressure. In clinical practice, physiologic or pharmacologic states that alter Ees may also increase afterload, thus having competing effects on stroke volume. The total area enclosed by the pressure-volume loops represents preloadrecruitable stroke work (PRSW) and can be used to extrapolate energy expenditure by the ventricle.
The end-diastolic pressure-volume relationship (EDPVR) is defined by connecting the end-diastolic points of the family of loops (Fig. 69.7). EDPVR reflects the pressure-volume relationship of the ventricle in its most relaxed state; it is inherently nonlinear as different muscle fibers are stretched at different points in the pressure-volume relationship. Constants can be derived from EDPVR to compare ventricular stiffness and diastolic function among individuals and between disease states. EDPVR is altered in patients with diastolic dysfunction, but, unlike ESPVR, EDPVR is less adaptable to changing physiologic states and altered hormonal control. Understanding the
differing effects of the EDPVR and ESPVR on stroke volume and the stroke work done by the heart provides unique insight into cardiovascular physiology in both disease and health.
differing effects of the EDPVR and ESPVR on stroke volume and the stroke work done by the heart provides unique insight into cardiovascular physiology in both disease and health.
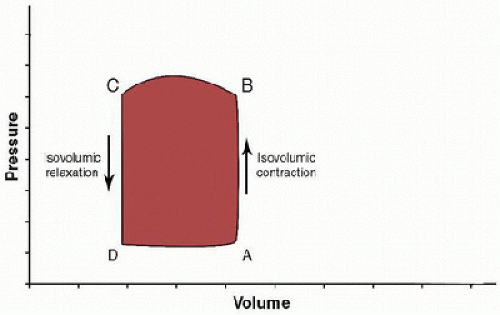 FIGURE 69.7. LV pressure-volume loop demonstrating the events of the cardiac cycle. Systole begins after point A with mitral valve closure. Then, the ventricle undergoes isovolumic contraction, followed by aortic valve opening (point B). Systole concludes after ejection and aortic valve closure (point C). Diastole begins with isovolumic relaxation, followed by mitral valve opening at point D. After filling of the ventricle, diastole ends at point A. |
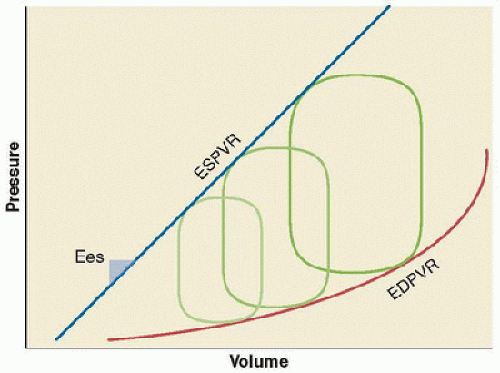 FIGURE 69.8. With acute alterations in preload (i.e., caval occlusion) or afterload (i.e., phenylephrine administration), a family of pressure-volume loops are generated. The linear ESPVR is defined by the connected end-systolic points of this group of curves; the slope of ESPVR is Ees. The nonlinear EDPVR describes the line generated by connecting the end-diastolic points of this group of loops. |
Stay updated, free articles. Join our Telegram channel

Full access? Get Clinical Tree


