KEY POINTS
In the last four decades, intensive care units (ICUs) and critical care researchers have amassed a great body of pathophysiologic and clinical knowledge that has advanced the care of critically ill patients. Severity of illness scoring systems are tools that have been designed to both predict and evaluate, from multiple perspectives, the outcomes of critically ill patients.
Most scoring systems evolved from multivariate regression analysis applied to large clinical databases of discovery cohorts to identify the most relevant factors for prediction of mortality. Scoring systems are then validated by prospective application to independent validation cohorts.
The ideal components of a scoring system are data collected during the course of routine patient management that are easily measured in most or all patients, inexpensive, objective, and reproducible.
The most widely applied scoring systems in adults are the Acute Physiology and Chronic Health Evaluation (APACHE), the Mortality Probability Models (MPM), Simplified Acute Physiology Score (SAPS), and Sequential Organ Failure Assessment (SOFA).
The uses of severity-of-illness scoring systems for cohorts of patients include clinical investigation (to compare study groups usually at baseline but sometimes over the course of ICU care), ICU administration (to guide resource allocation and budget), and assessment of ICU performance (to compare performance over time or between health care settings).
The use of scores to guide decisions about delivery of care to individual patients is controversial; in some studies the accuracy of prediction of outcomes of scoring systems is not greater than that of the individual clinician’s judgment.
INTRODUCTION
Severity-of-illness scoring systems were developed to evaluate the delivery of care and predict outcome of groups of critically ill patients admitted to intensive care units (ICUs). The purpose of this chapter is to review the scientific basis for these scoring systems and to make recommendations for their use. While there is a growing recognition that when properly administered, these tools are useful in assessing and comparing patient populations with diverse critical illnesses, their use for predicting individual patient outcome remains controversial and unresolved.
Novel propensity scoring systems and case:control matching strategies have also been developed and are now commonly used to simulate clinical trials to assess efficacy and safety of therapeutics in critical care.
PURPOSES OF SCORING SYSTEMS
There are six major purposes of severity-of-illness scoring systems (Table 13-1). First, scoring systems have been used in randomized controlled trials (RCTs) and other clinical investigations to assess balance of treatment and control groups at baseline.1-5 The second purpose of severity-of-illness scoring systems is to quantify severity of illness for hospital and health care system administrative decisions such as resource allocation and accreditation. The third purpose of scoring systems is to assess ICU performance and compare the quality of care between different ICUs and within the same ICU over time. For example, severity-of-illness scoring systems have been used to assess the impact on patient outcomes of planned changes in the ICU, such as changes in bed number, staffing ratios, and medical coverage.6 The fourth purpose of these scoring systems is to assess the prognosis of individual patients in order to assist families and caregivers in making decisions about ICU care. Novel propensity scoring systems and case:control matching strategies have been and are used to simulate clinical trials to assess efficacy and safety of therapeutics in critical care. This approach supplements (but may not replace) the need for RCTs to assess therapeutics in critical care.
Potential Uses of Severity-of-Illness Scoring Systems
| Uses of scoring systems in randomized controlled trials (RCTs) and clinical research |
|
|
|
|
|
|
| Uses of scoring systems for administrative purposes |
|
|
|
|
| Uses of scoring systems to assess ICU performance |
|
|
|
|
|
|
|
|
| Uses of scoring systems to assess individual patient prognosis and to guide care |
|
|
|
Finally, scoring systems are used to evaluate suitability of patients for novel therapy (eg, APACHE II was used to assess suitability of patients for prescription of the now discontinued recombinant human activated protein C [drotrecogin alfa] in sepsis).
The general hypothesis underlying the use of severity-of-illness scoring systems is that clinical variables assessed on ICU admission predict survival and other outcomes of critically ill patients. This hypothesis is based on observations that increasing age, presence of underlying chronic disease, and increasingly severe abnormalities of the physiology of critically ill patients are associated with increased mortality. Accordingly, most severity of illness scoring systems combine relevant acute and chronic clinical variables to predict risk of death. Early in this evolution, severity-of-illness scores calculated at ICU admission or in the 24 hours following ICU admission were used to predict hospital mortality. More recently, scores have been calculated over the course of the ICU stay to provide updated (and more accurate) prediction of hospital mortality. This dynamic approach uses change in acute organ dysfunction over time to enhance sensitivity, specificity, positive and negative predictive capability to mortality prediction.7-11
Scoring systems have been developed using databases from patients already admitted to ICUs and not from the pool of patients outside the ICU (eg, emergency, in-patient wards, operating room, and recovery room), where the triage decision to admit a patient to the ICU is made. While severity-of-illness scoring systems in theory could be used to increase the accuracy of triage decisions regarding appropriateness of ICU admission, reformulation of the current scoring methods would be necessary to reflect the patient population outside the ICU, where triage occurs. Obviously, ICU resources should be focused on patients who are most able to benefit from ICU care. However, to date there are no reports regarding the use of scoring systems to assist in decisions regarding appropriateness of ICU admission.
DEVELOPMENT OF SCORING SYSTEMS
The major scoring systems that are the focus of this chapter were designed specifically to predict outcome of critical illness. Initially, clinical and physiologic variable selection was based on subjective judgment and consensus of clinicians, supplemented by extensive review of the relevant critical care trials and outcomes literature. Subsequently, logistic regression modeling was used to select significant predictive variables from a (often very large) derivation cohort. Ideal variables are simple, inexpensive, well-defined, reproducible, and widely available measurements collected routinely in the course of patient care. The design and development of severity of illness scoring systems required collection of a large number of clinical and physiologic variables collected on a large sample size of critically ill patients, as well as survival status at ICU and hospital discharge. Multiple logistical regression identifies the specific variables that significantly predicted survival and assigns relative weights to each variable. This set of variables is then retested prospectively for accuracy of prediction in another sample of patients (termed a validation or replication cohort) to validate the selected variables and appropriate weighting of such variables.12
The sampling frequency and the time period of measurement of physiologic variables are important additional methodologic considerations in the development of severity of illness scoring systems. Most scoring systems use the most abnormal measurement of a physiologic variable in the 24 hours prior to ICU admission. More recently, scoring systems have used the most abnormal value of a physiologic variable for each successive 24-hour period while a patient is in the ICU, and then correlated these physiologic variables with outcome. Therefore, prediction prognosis could be adjusted daily depending on the patient’s course (natural history) and the patient’s physiologic response to treatment. In essence, changes in organ dysfunction are used to improve accuracy of outcome prediction.7-11 Studies have shown that the change in organ dysfunction from day 0 to day 1, from day 0 to day 3,9 and indeed from day to day,13 can be used to accurately predict outcome of the critically ill.
Another important consideration in the development of severity-of-illness scoring systems is the patient cohort used to derive the scoring system. For example, it is relevant to know whether scoring systems were derived in medical, surgical, or medical-surgical ICUs, whether community or tertiary care teaching hospital ICUs were used, whether ICUs were selected from one country or from many countries, and how many different ICUs were used to establish the scoring system. Furthermore, scoring systems derived from the sample of patients involved in a clinical trial may be biased (because of unique and often strict inclusion and exclusion criteria) and so may not represent a general population of critically ill patients (ie, generalizability is reduced).
Critical appraisal of severity-of-illness scoring systems assesses accuracy (calibration and discrimination), reliability, content validity, and methodological rigor.14
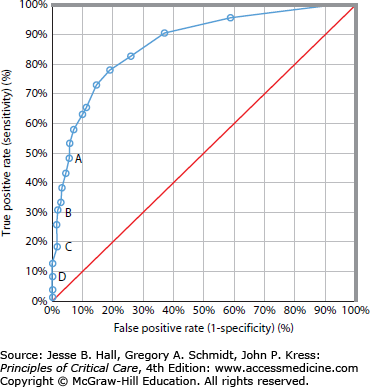
Discrimination describes the ability of a model to distinguish between a patient who will live and one who will die. If discrimination is perfect, there is no overlap in probability estimates between patients who live and those who die.15 Discrimination is described by the area under the receiver operating characteristic (ROC) curve15,16 (Fig. 13-1). The ROC curve shows the relation between the true-positive rate (sensitivity) and the false-positive rate (100% – specificity). Because sensitivity and specificity are computed from independent columns in the decision matrix, and are therefore independent of sample mortality, the area under the ROC curve represents the proportion of patients who not only died, but who also had a higher probability of death than the patients who lived.14
FIGURE 13-1.
The receiver operating characteristic (ROC) curve. The diagonal line indicates an index that operates no better than chance and has an area under the ROC curve of 0.5. Points A, B, C, and D correspond to decision criteria of 50%, 70%, 80%, and 90% predicted risk of death, respectively. A decision criterion of 0.5 (point A) means that every patient with a risk greater than 0.50 is predicted to die. The overall correct classification rate was 86%, with a sensitivity of 47% and a specificity of 92%. A decision criterion of 0.80 (point C) had an overall correct classification rate of 83%, with a sensitivity of 19% and a specificity of 93%. For a 90% predicted mortality, a scoring system has low sensitivity but high specificity. It is most specific for minimizing the prediction of a positive outcome (survival) when it actually does not occur, and poorly sensitive to predict the outcome (survival) when it actually occurs. (Reproduced with permission from Knaus WA, Draper EA, Wagner DP, et al. APACHE II: A severity of disease classification system. Crit Care Med. October 1985;13(10):818-829.)
The area under the ROC curve ranges from the lower limit of 0.5 for chance performance to 1.0 for perfect prediction. By convention, a model is considered to discriminate well when this area is greater than 0.8. An area of 0.9 means that a randomly selected actual nonsurvivor will have a more severe score than a randomly selected survivor 90% of the time.12 It does not mean that a prediction of nonsurvival occurs with probability 0.9, nor does it mean that a prediction of death is associated with observed nonsurvival 90% of the time. The area under the ROC curve illustrates the discriminating ability over the entire range of prediction scores.15
Calibration compares observed mortality with predicted mortality within the severity strata. Patients are placed into subgroups according to predicted risk. Typically, 10 strata are formed, called deciles of risk.15 Calibration is evaluated using goodness-of-fit tests; the most commonly used is the Hosmer-Lemeshow χ2 statistic.18 Typically, a 2 × 10 χ2 table is created, with 10 strata of probabilities. The lower the overall χ2, the better the fit. The calibration test must be interpreted with care, as it is very sensitive to sample size.
Reliability refers to inter- (between) and intraobserver (within) agreement in the use of any severity of illness score, and represents the agreement in the data collection.14 The greater the subjectivity of variables used in the scoring system (ie, choosing a primary diagnosis or assessing the level of consciousness in a sedated, intubated patient), the poorer the reliability of the system. Intraobserver reliability can be measured using a variety of techniques, and is expressed on a range between 0 (measurement involves nothing but error) and 1 (no variable error). A reliability coefficient of greater than 0.7 (suggesting that no more than 30% of the score is due to error) has been used as a statistical standard of reasonable relaibility.14 The kappa statistic measures interobserver reliability.
Content validity reflects the comprehensiveness of the model.14 Mortality is dependent not only on measured physiologic derangements and underlying health status, but may also be influenced by factors that are difficult to quantify, such as duration of organ system failure before treatment was instituted, staffing of an ICU, time of day of admission to ICU, and whether the admission was planned or unplanned, among others. In general, as the number of variables increase in a scoring system, the reliability and ease of capturing the data decrease. The exception would be inclusion of more variables that are easily collated from the large computerized clinical information systems used in most ICUs. In other words, this computerization of ICU variables could decrease the complexity produced by use of large numbers of patient variables in a severity of illness scoring system. Also, recording errors and transcription errors can be decreased by ICU computerization driving the data for severity of illness scoring systems. Nonetheless, the inclusion of many variables (overfitting) may actually reduce the performance of the model because some of these variables will be correlated with the outcome by chance alone. It has been proposed that stepwise regression should not be used unless there are at least 10 outcome events for each potential predictor.
Methodologic rigor refers to the avoidance of bias in development of a model. It is important that any severity-of-illness scoring system is based on a large cohort of all consecutive eligible patients to minimize bias.14 Several ICUs should be involved in data collection to minimize unique institutional bias in interpretation of coding or scoring rules. Chosen clinical and laboratory variables should be those that are routinely collected, because collection of unusual data (such as serum ammonia) may bias treatment (treatment effect). Rigor must be applied in the consistency of data collection, and rules for dealing with missing data need to be uniformly applied. Validation using a second independent validation cohort is important in assessing the reliability of the model. Finally, the usefulness of a rigorously developed and validated scoring system can be degraded by poor application.
SEVERITY-OF-ILLNESS SCORING SYSTEMS IN CLINICAL USE
The scoring systems most commonly used in critically ill adults are APACHE II,17 APACHE III,19 MPM II,20 SAPS II,21 and SOFA.7,22 The variables included in each of these scoring systems are summarized in Table 13-2. The Pediatric Risk of Mortality (PRISM) score23 is the most widely used scoring system in pediatric critical care.
Variables Included in Severity-of-Illness Scoring Systems in Clinical Use
| APACHE II | APACHE III | MPM II0 ADM | MPM II24 24 Hours | SAPS II | SOFA | |
|---|---|---|---|---|---|---|
| Age | X | X | X | X | X | |
| Prior treatment location | X | |||||
| Type of admission | X | X | X | X | X | |
| CPR prior to ICU admission | X | |||||
| Mechanical ventilation | X | X | ||||
| Vasoactive drug therapy | X | |||||
| Acute diagnoses | ||||||
| Acute renal failure | X | |||||
| Cardiac dysrhythmias | X | |||||
| Cerebrovascular incident | X | |||||
| Gastrointestinal bleeding | X | |||||
| Confirmed infection | X | |||||
| Intracranial mass effect | X | X | ||||
| Select one of 50 diagnoses | X | |||||
| Select one of 78 diagnoses | X | |||||
| Physiology | ||||||
| Temperature | X | X | X | |||
| Heart rate | X | X | X | X | ||
| Respiratory rate | X | X | ||||
| Blood pressure | X | X | X | X | X | |
| Pressor dose | X | |||||
| Hematocrit | X | X | ||||
| White blood cell count | X | X | X | |||
| Platelet count | X | |||||
| Albumin | X | |||||
| Bilirubin | X | X | X | |||
| Glucose | X | |||||
| Serum sodium | X | X | X | |||
| Serum potassium | X | X | ||||
| Serum bicarbonate | X | |||||
| Blood urea nitrogen | X | X | ||||
| Creatinine | X | X | X | |||
| Urine output | X | X | X | X | ||
 | X | X | X | X | X | |
 | X | |||||
| pH and PCO2 | X | X | ||||
| Prothrombin time | X | |||||
| GCS or modified GCS | X | X | X | X | ||
| Coma or deep stupor | X | X | ||||
| Chronic health status | ||||||
| AIDS | X | X | X | |||
| Immunosuppression | X | X | ||||
| Lymphoma | X | X | a | |||
| Leukemia/mult. myeloma | X | X | a | |||
| Metastatic cancer | X | X | X | X | ||
| Hepatic failure | X | X | ||||
| Cirrhosis | X | X | X | X | ||
| Chronic renal insufficiency | X | X | ||||
| Chronic coronary insufficiency | X | |||||
| Chronic respiratory insufficiency | X |
Some clinical variables are common to APACHE II, APACHE III, MPM II, SAPS II, and SOFA, probably because these variables measure specific clinical and physiologic functions that have been reproducibly shown to be major predictors and in some cases causal determinants of mortality. Specifically, each of these scoring systems uses age, type of admission, heart rate, blood pressure, assessment of renal function (blood urea nitrogen, creatinine, and/or urine output), assessment of neurologic function (Glasgow Coma Scale [GCS] or presence of coma), assessment of respiratory function (mechanical ventilation, [Math Processing Error], or alveolar-arterial oxygen gradient), and assessment of chronic health status. In contrast, other variables are not uniformly shared: serum potassium in APACHE II, glucose and albumin in APACHE III, and serum bicarbonate in SAPS II. These unique variables exist because of differences in the derivation of each scoring system, such as patient sample size, types of ICUs and patients included, and statistical methods used to derive each score. An important difference between severity of illness scoring systems is how the predictor variables were chosen.24 For instance, in the APACHE II model, the developers selected those variables they thought relevant to patient outcome and then arbitrarily weighted each variable. In the development of MPM II, SAPS II, and APACHE III, statistical techniques identified agnostically variables independently associated with death. These variables were then further refined by use of linear discriminant function and stepwise logistic regression analysis, and the final set of variables were then weighted by statistical methods and presented as a cumulative score to predict mortality.
The Acute Physiology and Chronic Health Evaluation II (APACHE II) system17 is the most commonly used clinical severity-of-illness scoring system in North America. APACHE II is a disease-specific scoring system. It uses age, type of admission, chronic health evaluation, and 12 physiologic variables (acute physiology score or APS) to predict hospital mortality (see Table 13-2). The 12 physiologic variables are defined as the most abnormal values during the 24 hours after ICU admission.
The predicted hospital death rate is computed from the weighted sum of APACHE II score, a variable determined by whether the patient had emergency surgery, and the specific diagnostic category weight. The original publication in 1985 of APACHE II score was validated in 5815 ICU admissions from 13 hospitals. The correlation of APACHE II and predicted mortality is likely not accurate after nearly 30 years of progress including changes in ICU design and administration, wide presence of trained intensivists, introduction of many new therapies and protocolized care. In the original APACHE II report, the correct classification rate for a 50% predicted risk of death was 85%.
APACHE III19 extended APACHE II by improving calibration and discrimination through the use of a much larger derivation and validation patient sample. However, at this time, APACHE III is a proprietary commercial product.
The main disadvantages of the APACHE II system are its failure to compensate for lead-time bias,25 the requirement to select only one clinical diagnosis, inaccuracies in clinical subsets, which produce poor interobserver reliability and its derivation from cohorts nearly 30 years ago. To reemphasize, the derivation set of APACHE II is now nearly 30 years old and so the absolute predictions are quite inaccurate and dated. Nonetheless, comparison of contemporaneously collected patients (such as a treatment and control group in an RCT) may be compared for similarity of APACHE II scores. If there are differences in APACHE II scores between cases and controls at baseline, that raises concerns about interpretation of the main study results (because differences in baseline risk of death could explain differences between treatment groups in observed mortality rate). A lack of balance between treatment groups at baseline drives the need for an adjusted analysis in which APACHE II score and treatment group are covariates in the analyses. In spite of these shortcomings, APACHE II remains the most well known and most widely used severity of illness scoring system.24
APACHE III is a disease-specific score that was developed from 17,440 admissions in 40 US hospitals. Eighteen variables (see Table 13-2) were included, and their respective weights were derived by logistic regression modeling. To improve the accuracy of assessment of neurologic function, the GCS score was changed, because reliability testing suggested the need to eliminate similar GCS scores that could occur in patients who had different neurologic presentations. The APACHE III score sums physiology, age, and data variables from seven potential comorbid conditions. The final APACHE III score can vary between 0 and 300. Risk estimate equations for hospital mortality are calculated from the weighted sum of disease category (78 diagnostic categories are included), a coefficient related to prior treatment location, and the APACHE III score. In the original derivation sample, estimates of mortality for the first day in the ICU had an area under the ROC curve of 0.90, and the correct classification at 50% mortality risk level was 88%. Although APACHE III scores can be calculated from published information, weights to convert the score to probability of death are proprietary; therefore, the full commercial APACHE III system has not been widely accepted or used. However, some trials groups (eg, ARDSnet) use APACHE III raw scores to compare treatment groups at baseline in their trials.
The Mortality Probability Model (MPM II)20 was developed from 19,124 ICU admissions in 12 countries. MPM II is not disease specific. MPM0 is the only severity-of-illness scoring system that was derived at ICU admission and can therefore be used at ICU admission. MPM II does not yield a score, but rather a direct probability of survival. Burn, coronary care, and cardiac surgery patients are excluded. MPM0 includes three physiologic variables, three chronic diagnoses, five acute diagnoses, and three other variables: cardiopulmonary resuscitation prior to admission, mechanical ventilation, and medical or unscheduled surgery admission (see Table 13-2). Each variable is scored as absent or present and is allocated a coefficient. The sum of these coefficients constitutes the logit that is used to calculate the probability of hospital mortality.
The MPM2420 was designed to be calculated for patients who remained in the ICU for 24 hours or longer. MPM24 includes 13 variables, 5 of which are used in the MPM0. In the validation data set, the area under the ROC curve was 0.82 and 0.84 for the MPM0 and MPM24, respectively.
The Simplified Acute Physiology Score II (SAPS II)21 was developed from a sample of 13,152 admissions from 12 countries, based on a European/North American multicenter database. SAPS II is not disease specific. SAPS II uses 17 variables (see Table 13-2) that were selected by logistic regression: 12 physiology variables, age, type of admission (scheduled surgical, unscheduled surgical, or medical), and three underlying disease variables (acquired immunodeficiency syndrome, metastatic cancer, and hematologic malignancy). The area under the ROC curve was 0.86 in the validation sample. The probability of hospital mortality is calculated from the score. SAPS is widely used in Europe and less widely used in North America.
The Sequential Organ Failure Assessment (SOFA) was originally developed as a descriptor of a continuum of organ dysfunction in critically ill patients over the course of their ICU stay.22 The SOFA score is composed of scores from six organ systems, graded from 0 to 4 according to the degree of dysfunction/failure. The score was primarily designed to describe morbidity; however, a retrospective analysis of the relationship between the SOFA score and mortality was developed using the European/North American Study of Severity System database.7,21 Subsequently, SOFA was evaluated as a predictor of outcome in a prospective Belgium study.13 SOFA score on admission was not a good predictor of mortality (area under the ROC curve 0.79); however, mean SOFA score and highest SOFA score had better discrimination (area under the ROC curve 0.88 and 0.90, respectively). Independent of the initial value, an increase in the SOFA score during the first 48 hours of ICU admission predicts a mortality rate of at least 50%. SOFA is quite commonly used in assessing balance at baseline of treatment groups in RCTs, especially in Europe.
All severity-of-illness scoring systems at ICU admission have relatively high rates of misclassification of survivors and nonsurvivors. Misclassifications may be caused by (1) inadvertent exclusion of strong outcome risk factors that cannot be measured or were not measured at ICU admission, (2) inadvertent exclusion of complications that occur during ICU stay,26 and/or (3) inadvertent exclusion of treatment effects that modify outcome. Scoring systems applied over the course of the ICU stay can diminish the impact of these factors. However, discrimination of scoring systems applied during the ICU course is lower than discrimination of scoring systems evaluating outcome at the time of initial admission to the ICU.
MPM48 and MPM7227 were developed to estimate the probability of hospital mortality at 48 and 72 hours in the ICU. MPM48 and MPM72 have the same 13 variables and coefficients that are used in MPM24, but the models differ in the constant terms, which reflect the increasing probability of mortality with increasing length of ICU stay, even if physiologic parameters are constant. In the validation group, the areas under the ROC curves of MPM48 and MPM72 were 0.80 and 0.75, respectively.
APACHE III can also be used to calculate a daily risk of hospital mortality.28 A series of multiple logistic regression equations was developed for ICU days 2 to 7. The APACHE III daily risk estimate of mortality includes the APS on day 1, APS on current day, change in APS since the previous day, the indication for ICU admission, the location and length of treatment before ICU admission, whether the patient was an ICU readmission, age, and chronic health status.
The SOFA score has been used to increase accuracy of outcome prediction over the first 7 days of the ICU course.13 The changes in SOFA score in cardiovascular, renal, and respiratory dysfunction from day 0 to day 1 of sepsis were significantly correlated with 28-day mortality in two large cohorts of patients who had severe sepsis.
Comparing the accuracy of the different scoring systems is difficult because of differences in populations used to derive these scores and different statistical methods. Thus there have been few head-to-head comparisons of different scoring systems. A multinational study29 compared different generations of the three main severity-of-illness scoring systems in 4685 ICU patients. APACHE III, SAPS II, and MPM II all showed good discrimination and calibration in this international database and performed better than did APACHE II, SAPS, and MPM. APACHE II and APACHE III have been compared in 1144 patients from the United Kingdom.30 APACHE II showed better calibration, but discrimination was better with APACHE III. Both scoring systems underestimated hospital mortality, and APACHE III underestimated mortality by a greater degree.
Clinical judgment to predict outcome has been criticized because it is not very reproducible, it has a tendency to overestimate mortality risk, and bias is introduced by the ability to recall particularly memorable, rare, and recent events.15 Three studies compared APACHE II with physicians’ mortality predictions in the first 24 hours of ICU admission,31-33 and one study evaluated physicians’ predictions only.34 Discrimination by physicians had ROC curve areas ranging between 0.85 and 0.89, which were similar to32,34 and even significantly better than those of APACHE II.31,33 In contrast to ability to discriminate, calibration rate of physicians’ predictions of mortality versus APACHE II differed. For high-risk patients, APACHE II and physicians had similarly correct predictions for mortality, ranging from 71% to 85%. However, for estimated mortality risks below 30%, rates of correct classification of physicians’ predictions were 39% to 69%, compared with 51% to 67% for APACHE II.31
Severity-of-illness scoring systems have been developed, derived, and validated for specific diseases to improve the accuracy of general scoring systems. APACHE III uses 74 disease classifications and derives a unique mortality risk prediction for each of these disease classifications. New scoring systems have been introduced to better predict mortality for patients with multiple organ failure and sepsis. The original models of SAPS II and MPM II did not perform well in patients who had severe sepsis, because mortality in severe sepsis was higher than mortality in patients with other diagnoses. Both models subsequently were customized5 for sepsis by using the original data to derive coefficients unique for sepsis to calculate predicted mortality. Furthermore, severity-of-illness scoring systems specifically designed for sepsis have been developed.
Prediction of mortality in sepsis will likely benefit from a dynamic approach that is based on evolution of multiple organ dysfunction. Commonly used organ failure–based systems that have been studied include the SOFA score,22 the Multiple Organ Dysfunction Score (MODS),35 and the Logistic Organ Dysfunction System (LODS).36
All three systems attribute points for organ dysfunction in six different organ systems. MODS,35 which applies to surgical patients, differs from SOFA and LODS in the cardiovascular assessment. MODS scores the cardiovascular system based on the “pressure-adjusted heart rate,” defined as the product of the heart rate multiplied by the ratio of the right atrial pressure to the mean arterial pressure. LODS and MODS have excellent discrimination, with ROC curve areas of 0.85 and 0.93, respectively.35,36
Related posts:


Stay updated, free articles. Join our Telegram channel

Full access? Get Clinical Tree


