1 The development of acute kidney injury is associated with a significant increase in mortality in the critically ill patient despite existence of dialytic support capable of replacing the filtering function of the kidney. Because no specific therapy exists for treating acute kidney injury, prevention is critical.
2 Prerenal azotemia and obstructive uropathy are rapidly reversible causes of acute kidney injury that should be sought in every case and aggressively treated.
3 Acute kidney injury not caused by prerenal or postrenal causes is commonly the result of combined hypoperfusion and drug-induced injury.
4 Medications need to be carefully selected and adjusted for the degree of renal insufficiency.
5 For most patients, intermittent, alternate day conventional hemodialysis represents the best option for managing fluid status, uremia, and electrolyte and acid-base disorders. If fluid overload is the predominant problem, or the patients is hemodynamically unstable, continuous renal replacement theraphy represents a reasonable alternative.
6 When acute renal failure occurs in a patient with previously normal kidneys, renal function can be expected to return to near baseline levels, provided the patient survives the critical phase of illness.
The kidney’s excretory function can be replaced mechanically and its metabolic functions can be compensated by the actions of the lung or liver or replaced by drugs. Therefore, the kidney is the only major organ whose total failure is not necessarily fatal. Yet the development of acute kidney injury (AKI) in a critically ill patient is associated with significantly higher morbidity and mortality. A greater appreciation of the importance of maintaining adequate perfusion and avoiding nephrotoxic compounds might have reduced the incidence and severity of AKI, but for an aging population with an increasing incidence of diabetes and hypertension. Fortunately, the safety and efficiency of renal replacement therapy (RRT) has improved permitting treatment of patients who previously would have not been candidates.
▪ INDICES OF RENAL FUNCTION AND INJURY
Urine Volume
Urine volume usually tracks kidney perfusion, whereas urine specific gravity and osmolality parallel concentrating ability (tubular function). Therefore, renal blood flow is probably adequate in nonoliguric patients and patients producing concentrated urine are unlikely to have significant tubular damage. However, it is important to note that concentrated urine does not imply normal perfusion; the standard response of the kidney to inadequate perfusion is to concentrate the urine. Certain calculated indices have long been used to distinguish problems of perfusion from those of tubular dysfunction but all of these measures have a much lower specificity than commonly believed (Table 29-1).
Blood Urea Nitrogen
Because the kidney is the primary filter of nitrogenous waste, blood urea nitrogen (BUN) and creatinine track renal function, but do so imperfectly. The extreme variation of urea load and the ability of the proximal tubule to absorb filtered urea render BUN less reliable than creatinine for this purpose. For example, rhabdomyolysis, increased protein ingestion, gastrointestinal (GI) bleeding, and corticosteroid use may all increase the BUN, whereas liver disease, low protein diets, or low muscle mass decrease BUN. In addition, when urine flow declines because of volume depletion, the BUN rises disproportionately, as it is reabsorbed along with sodium and water. Conversely, when glomerular filtration rate (GFR) is increased such as in pregnancy and during aggressive volume resuscitation, the BUN declines. As general guidelines, the BUN increases by 10 to 15 mg/dL/day and creatinine by 1 to 2.5 mg/dL/day after abrupt renal shutdown. The serum potassium (K+) usually rises less than 0.5 mEq mg/dL/day, and bicarbonate (HCO3) falls by about 1 mEq/L day. Under the catabolic stress of burns, trauma, rhabdomyolysis, steroids, severe sepsis, or starvation, the rates of change of these parameters may be doubled.
TABLE 29-1 LABORATORY INDICES IN ACUTE RENAL FAILURE
PRERENAL
INTRARENAL
BUN/creatinine
>10:1
Approx. 10:1
Urinary Na+ concentration
<20 mEq/L
>40 mEq/L
Urine specific gravity
>1.020
1.010 -1.020
Urine osmolality
>500 mOsm/L
<300-400 mOsm/L
Urine creatinine/plasma creatinine
>40
<20
Urine Na+/creatinine clearance
<1
>2
Na+ clearance/creatinine clearance (FeNa)
<1
>1
Urine sediment
Normal or hyaline casts
Active with granular casts
Creatinine
In contrast to BUN, daily creatinine production is more consistent. Patients with low muscle mass from starvation, limb amputation, or neuromuscular disease and those with a protein-restricted diet, have on average lower creatinine values than patients with conventional diets and body composition. A rising creatinine indicates that the rate of production exceeds its combined clearance by filtration and proximal tubular secretion because the kidney does not reabsorb or metabolize creatinine. For these reasons, a stable elevation of creatinine implies that a new steady state has been achieved at a decreased GFR. The best method to determine GFR is a 24-h urine collection but logistical problems, the inherent delay imposed, and the high incidence of severe oliguria usually make this impractical. Consequently, GFR is typically estimated using the Cockcroft-Gault equation: GFR (mL/min) = [(140 – age in years) × weight in kilograms]/(Serum creatinine × 72) or the more complex modification of diet in renal disease (MDRD) equation: GFR (mL/min/1.73m2) = 170 × (Serum creatinine)-0.999 × age (years)-0.176 × 0.762 (if female) × 1.8 (if African American) × BUN (mg/dL)−0.170 × albumin (g/dL)0.318. Fortunately, both of these equations are widely available in online calculator sites.
It is important to understand that because serum creatinine increases lag behind the deterioration in actual GFR, kidney function cannot be reliably assessed until creatinine stabilizes. For this reason, drug doses are usually overestimated by the calculated GFR during the evolution of AKI. Thus, if a patient becomes anuric or severely oliguric, it is probably best to estimate drug dosing based on a GFR of zero. Without intervention, creatinine usually plateaus at 12 to 15 mg/dL, depending on catabolic state. (Rhabdomyolysis can cause creatinine to exceed this value.)
Normally, about 15% of urinary creatinine is secreted by the proximal tubule (a higher fraction in renal failure). As a result, drugs that compete with creatinine for tubular secretion like trimethoprim and cimetidine may increase serum creatinine despite a preserved GFR. One creatinine assay method (alkaline picrate) is subject to interference by acetoacetate, flucytosine, and cefoxitin, causing artifactual elevations in measured serum creatinine.
Cystatin C
Because creatinine and BUN are flawed, better measures of function have been sought. Cystatin C, a proteinase inhibitor synthesized and released at a nearly constant rate by all nucleated cells, is an attractive option. This compound is filtered by the glomerulus and is completely metabolized by the proximal renal tubule without secretion or reabsorption. Hence, increases in serum levels correlate well with declines in GFR. In addition, the rise in serum cystatin C after kidney injury may precede increases in serum creatinine by 1 to 2 days providing an early marker of injury. The major drawback of cystatin C currently is limited assay availability.
TABLE 29-2 RIFLE CRITERIA FOR ACUTE KIDNEY INJURY
STAGE
GFR CRITERIA
URINE OUTPUT CRITERIA
ASSOCIATED MORTALITY RATE
Risk
1.5-Fold creatinine increase or GFR decrease >25%
<0.5 mL/kg/h for 6 h
20%-40%
Injury
2-Fold creatinine increase or GFR decrease >50%
<0.5 mL/kg/h for 12 h
40%-50%
Failure
3-Fold creatinine increase or GFR decrease >75% or Creatinine ≥4 mg/dL (with acute rise >0.5 mg/dL)
<0.3 mL/kg/h for 24 h or Anuria for 12 h
55%-75%
Loss
Persistent failure for >4 weeks
ESRD
End-stage renal disease
New Markers of Kidney Injury
In an attempt to identify very early AKI and better localize the site of injury within the kidney, several new biomarkers have been investigated. Three of these compounds, Interleukin 18 (IL-18), kidney injury molecule 1 (KIM-1), and neutrophil gelatinase-associated lipocalin (NGAL) demonstrate promise. After renal insult, all three compounds have been identified in serum well before creatinine or BUN become abnormal.
▪ DEFINITIONS OF ACUTE KIDNEY INJURY
Innumerable definitions of “renal failure” have been used causing difficulty interpreting the literature in this field. Traditionally, a rise in creatinine of 0.5 mg/dL or a doubling of creatinine or (halving of calculated GFR) has been considered clinically significant. Oliguria has been defined variably as urine production less than 400 mL/day or less than 0.5 mL/kg/h. The mortality of oliguric renal failure is at least twofold greater than nonoliguric failure, and for survivors time to recover function is shorter among nonoliguric patients. Reasons for these observations are uncertain but probably reflect differences in severity of AKI and perhaps etiology. Unfortunately, little data suggest that “converting” oliguric to nonoliguric renal failure using diuretics alters outcome.
In the last few years, the development of a standardized staging system, RIFLE, has been useful. The RIFLE system (Table 29-2) uses calculated GFR and urine output to classify patients along a continuum of risk, injury, or failure, and then fine-tunes the duration of failure as either persistent loss (>4 weeks) or end-stage disease (>3 months). The system has been validated in a variety of critically ill populations. Recent data suggest that perhaps even smaller changes in creatinine (0.3 mg/dL) than those of the RIFLE risk group are associated with an increased length of stay needed for RRT and risk of death.
▪ ETIOLOGY OF ACUTE KIDNEY INJURY
Approximately, 20% of critically ill patients develop AKI—an incidence five times that of the general hospital population. The risk of developing AKI is highest among patients who have underlying renal impairment. Roughly, 25% of these patients or 5% of all ICU residents will receive RRT. The etiology of AKI differs drastically, depending on whether the condition develops in or outside the hospital and varies with the chronicity of the process. For example, poorly controlled hypertension and diabetes mellitus are the most common etiologies of slowly developing renal failure outside the hospital. When AKI develops outside the hospital, glomerulonephritis (GN), vasculitis, and obstructive uropathy are common causes. By contrast, AKI developing in the hospital is much more likely to be the result of hypoperfusion or drug toxicity— often now on a background of mild chronic renal dysfunction.
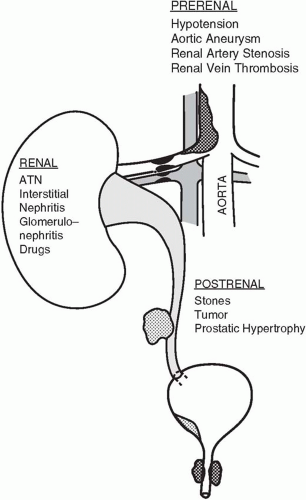
▪ FIGURE 29-1 Common causes of acute renal failure in the intensive care unit.
AKI may result from a variety of causes acting through one of three common mechanisms: (a) hypoperfusion (prerenal), (b) outlet obstruction (postrenal), or (c) parenchymal disease (intrarenal) (Fig. 29-1).
Prerenal Failure
Hypoperfusion accounts for half of all cases of AKI; hence, prevention of hypotension or its rapid reversal is probably the most effective therapy. Although prolonged ischemia alone may lead to AKI, in most cases the etiology is multifactorial (i.e., severe sepsis, drugs, and hypotension). In general, mean arterial pressures less than 60 to 70 mm Hg for longer than 30 min risk injury, particularly if there is accompanying hypoxia. Hypoperfusion results from circulatory failure, hypotension, vascular obstruction (e.g., renal artery stenosis, vasculitis, embolization of bland clot or cholesterol or maldistribution of cardiac output (CO), as in severe sepsis. The hepatorenal syndrome (see Chapter 31) and the renal response to positive end-expiratory pressure (PEEP) mimic prerenal physiology by redistributing blood flow away from the filtering glomerulus.
Marked increases in intra-abdominal pressure (abdominal compartment syndrome), usually greater than 25 mm Hg, resulting from the accumulation of ascitic fluid or blood, can also produce a prerenal state. It is uncertain if elevated abdominal pressures lessen urine flow by reducing CO through impaired venous return; by obstructing kidney arterial supply or venous outflow; or by compressing the kidney parenchyma directly. It appears unlikely that ureteral obstruction is etiologic because placement of ureteral stents does not improve flow. Regardless of mechanism, when elevated pressures are responsible for oliguria, decompressive laparotomy or paracentesis is associated with a near immediate restoration of urine flow.
Indicators of Intravascular Volume Status
Orthostatic blood pressure is a helpful clinical measure of intravascular volume status in healthy persons. However, few critically ill patients can be tested in this fashion, and autonomic insufficiency renders such changes less reliable in patients who are diabetic, elderly, or bedridden. Dry mucous membranes, skin laxity, and absence of axillary moisture may also be clues to hypovolemia. Unfortunately, these signs, too, prove unreliable in patients with hyperpnea or advanced age. For the hospitalized patient, a persistently negative fluid balance supports a prerenal diagnosis.
Response to fluid challenge is the diagnostic hallmark of prerenal disease. The rate and volume of fluid administered must be customized taking into account the estimated magnitude of the deficit, and cardiopulmonary reserves. Repeated boluses of 15 to 20 mL/kg are typically administered until deemed futile or function improves. Because noninvasive methods to assess fluid status (chest radiograph and echocardiogram) are insensitive tests of intravascular depletion, invasive monitoring is often undertaken (see Chapter 2). The need for invasive monitoring is controversial, however, because no particular values for central venous pressure (CVP), pulmonary artery occlusion pressure (PAOP), CO, or systemic vascular resistance (SVR) guarantee sufficient or inadequate renal blood flow. That is, glomerular pressure and flow are poorly gauged by these hemodynamic measures. Nevertheless, a low intravascular pressure (i.e., CVP ≤2 or PAOP ≤5 mm Hg) can be diagnostically helpful, especially if CO is reduced concomitantly.
In prerenal failure initially the urinalysis is normal or minimally abnormal with hyaline casts and other nonspecific sediment; however, if the injury is sufficient to induce tubular damage, typical ATN sediment will be present. A prerenal state prompts the tubule to reabsorb Na+ and water, yielding concentrated urine with low Na+. A urine Na+ less than 20 mEq/L, urine osmolality greater than 500 mOsm/L, and the urine specific gravity greater than 1.015 are typical. The fractional excretion of sodium (FeNa) is another commonly used index to identify the prerenal state that measures the percentage of filtered sodium that is excreted. FeNa is calculated as the ratio of the urine Na+ concentration times the plasma creatinine concentration to the product of the plasma Na+ concentration times the urine creatinine concentration. FeNa = ([Urine Na+] × [Plasma creatinine])/([Plasma Na+] × [Urine creatinine]) × 100. FeNa values less than 1% are generally indicative of prerenal disease, whereas values greater than 3% usually represent acute tubular necrosis (ATN). Intermediate values are not helpful and there are exceptions to this rule. For example, up to 10% of cases of ATN have a low FeNa. For urine Na+ or FeNa measurements to be valid, the underlying Na+ reabsorbing capacity of the renal tubule must be intact. For this reason, chronic renal failure, hypoaldosteronism, and metabolic alkalosis may all render tests of urine Na+ invalid. Likewise, diuretic therapy invalidates urine Na+ determinations for at least 24 h. Osmotic agents (glucose, mannitol, radiographic contrast) also confuse interpretation of urine chemistry values by diluting the urine.
TABLE 29-3 KIDNEY SIZE AS A CLUE TO THE ETIOLOGY OF RENAL FAILURE
NORMAL
ENLARGED
SMALL
Acute glomerulonephritis
Amyloidosis
Chronic renal failure
Acute tubular necrosis
Acute glomerulonephritis
Chronic hypertension
Acute cortical necrosis
Acute interstitial nephritis
Acute interstitial nephritis
Obstructive uropathy
Hepatorenal syndrome
Renal vein thrombosis
Malignant hypertension
Acute transplant rejection
Renal artery obstruction
Scleroderma
Although the BUN may be disproportionately high because of increased urea production resulting from tetracycline, corticosteroids, or GI bleeding, an elevated BUN/creatinine ratio more commonly results from reduced tubular urine flow and increased proximal tubular reabsorption of urea nitrogen. Thus, in prerenal states the BUN/creatinine ratio is usually elevated (>10:1; sometimes >20:1). Because the renal tubules cannot absorb creatinine, reduced tubular flow rates have no effect on the creatinine concentration if GFR is preserved. Comparing urea clearance to creatinine clearance will determine whether increased urea production or decreased urea excretion is the cause of an elevated BUN. If the urea/creatinine clearance ratio is greater than 1, increased production is the likely etiology. The most common clinical task is to differentiate prerenal disease from ATN. Table 29-1 compares the more common renal function indicators in these two conditions. Imaging studies of the kidneys may also provide clues to the cause of renal failure (Table 29-3). In most forms of AKI, the kidneys will be of normal size when imaged with ultrasound or computed tomography (CT). Small kidneys suggest a more chronic process (e.g., diabetes or hypertension) with a superimposed insult.
Only gold members can continue reading. Log In or Register to continue