Acid-Base Disorders
KEY POINTS
1 Viewed in isolation, most ABGs defy unique interpretation for cause or mandate immediate action; each blood gas must be evaluated in light of clinical information and electrolyte status. The technique for obtaining blood gases is critically important for accurate diagnosis.
2 During health, acid-base balance is finely tuned within a narrow range, using complex buffering systems and compensatory responses. Usually, the respiratory system responds quickly to metabolic derangements but ultimately achieves less complete compensation. By contrast, the kidney slowly compensates for respiratory abnormalities but eventually achieves and sustains a near-complete compensatory response.
3 The Stewart and Henderson-Hasselbach approaches to acid-base evaluation use different systems to reach the same point (diagnosis). Using the adjusted anion gap (considering albumin concentration) improves the classic approach to detect hidden acid-base disorders in hospitalized patients. These approaches are of equal validity, differing only in how they approach the understanding of the underlying mechanism.
4 The rules of compensation for primary acid-base disorders in Table 12-1 are important for the accurate evaluation of acid-base disorders. They should be memorized or kept closely at hand.
5 The anion gap provides a valuable tool to determine whether a metabolic acidosis is the result of loss of bicarbonate or the result of titration of bicarbonate with excess hydrogen ion equivalents. It makes good sense to calculate the anion gap whenever evaluating electrolytes and ABGs. The anion gap provides a useful framework for the differential diagnosis of metabolic acidosis. A short list of common conditions usually is responsible for elevating the anion gap (Table 12-3).
6 Hypoalbuminemia can mask an increased concentration of gap anions by lowering the value of the anion gap.
7 Non-anion gap acidosis often results from administration of large volumes of chloride containing fluids. This occurs frequently in patients with GI loses of bicarbonate.
8 Dilutional acidosis is observed when the patient is infused with high volumes of base-free solutions (e.g., sodium chloride), but the physiological consequences of this type of acidosis are rarely significant at the intracellular level.
9 The management of acid-base disorders requires comprehensive knowledge of the clinical setting. Bicarbonate correction of acidosis is appropriate in extreme cases where acidosis compromises hemodynamic status or when a depleted bicarbonate buffer base must be replenished. THAM, another buffer, has not been associated with the increase of intracellular acidosis and occasionally can be a useful alternative to bicarbonate.
The earliest contemporary definitions of acid and base can be attributed to Arrhenius, who in 1887 defined acid as a hydrogen-ion donor and base as a hydroxyl-ion donor. In 1948, Singer and Hastings proposed the concept of whole blood buffer base (BB) as a quantitative index of the surplus amount of fixed acid or base in the blood. In 1960, Astrup proposed the concept that standard bicarbonate or base excess should be used as an index of the nonrespiratory acid-base status of the blood. Standard bicarbonate is defined as the concentration of bicarbonate in plasma after fully oxygenated whole blood equilibrates with carbon dioxide at PCO2 of 40 torr. The carbonic acid/bicarbonate system was introduced by Henderson-Hasselbach, whose equation considers the pH to depend on the interactions of these variables. In
1983, the concept of BB was reintroduced by Stewart under the name “strong ion difference” (SID), based on the principles of electroneutrality and mass conservation. Therefore, three related but different methods to analyze acid-base status are currently used: the Henderson-Hasselbach relationship, the base excess, and the SID. To establish an accurate physiologic diagnosis and manage the different disturbances of acid-base balance requires integration of blood gas data with the electrolyte profile and clinical findings.
1983, the concept of BB was reintroduced by Stewart under the name “strong ion difference” (SID), based on the principles of electroneutrality and mass conservation. Therefore, three related but different methods to analyze acid-base status are currently used: the Henderson-Hasselbach relationship, the base excess, and the SID. To establish an accurate physiologic diagnosis and manage the different disturbances of acid-base balance requires integration of blood gas data with the electrolyte profile and clinical findings.
▪ ARTERIAL BLOOD GASES
Obtaining Arterial Blood Gases
Arterial blood gases (ABGs) are valuable only if obtained properly and measured carefully. Patients should have a stable FiO2 for at least 15 min before sampling to allow the PaO2 and PaCO2 to equilibrate. Patient position should be noted because PaO2 may change significantly with varying body position (saturation usually is worse in the supine position). Ventilatory pattern (breath-holding or hyperventilation) also should be noted. Changes in breathing rate or depth may significantly alter the PaCO2 and PaO2 from the prior condition. Prolonged attempts to obtain an ABG often result in mild hyperventilation as pain and/or anxiety build in the patient.
The patient’s body temperature should be re corded. For any given O2 content, the measured PaO2 increases as blood is warmed. An increased PaO2 occurs because of rightward shifts in the oxyhemoglobin dissociation curve and because the solubility of gases decreases in warmer fluids increasing their measurable tensions. Hypothermia shifts the oxyhemoglobin dissociation curve leftward; therefore, as cold blood is warmed to the standard analysis temperature (37°C), O2 solubility decreases (resulting in a higher measured PaO2 than exists in vivo). The PaCO2 also will rise as blood is warmed, producing modest declines in the pH.
When sampling or cannulating the radial artery, it is advisable to assess collateral blood flow to the hand, as trauma to that vessel may later result in clotting and/or compromise its patency. The patency of the alternate blood supply, the ulnar artery, is confirmed by the Allen test, first described in 1929. It is performed by elevating the hand, occluding both ulnar and radial arteries, and releasing compression of the ulnar artery. If adequate collateral circulation is present, the hand should flush pink within 5 to 7 s. It is important to remember that the Allen test has high variability among observers, and its ability to detect inadequate collateral circulation is not high in the hypotensive ICU population. Its performance must be considered, however, prior to placing a radial arterial line. For arterial puncture, the wrist is positioned in mild extension and the skin is cleaned—first with an iodophor or chlorhexidine solution and then wiped with alcohol. Lidocaine (approx. 0.5 mL of 1% solution) may be used to prevent pain in the alert subject. Excessive anesthetic volume may obliterate normal landmarks and arterial pulsations. Commercially prepared ABG syringes are usually used; however, in their absence, a heparin-coated 3-mL syringe tipped with a 21-gauge needle will suffice. The artery is approached from a 45 degree angle, and immediately on vessel entry, pulsatile blood will fill the syringe (aspiration is not necessary in most cases). Blood flow will cease if the needle penetrates the posterior arterial wall, but flow often may be reestablished merely by retracting the needle. After sampling is complete, the needle should be removed and firm pressure should be applied to the puncture site for 5 min (or longer if coagulation disorders exist). The blood and heparin should be mixed by a rolling motion. Prompt analysis is required to obtain accurate results, and icing is needed unless the sample is analyzed immediately.
Pitfalls in Collection, Analysis, and Interpretation
Timing of Analysis
Accuracy depends on prompt analysis. Under most circumstances, the PaCO2 rises approximately 3 to 10 mm Hg/h in uniced specimens, causing a modest fall in pH. The PaO2 usually remains stable in an iced sample for 1 to 2 h. Samples of body fluids that do not contain sufficient hemoglobin or other protein buffers (e.g., pleural or joint fluid) undergo more rapid pH changes when analysis is delayed.
Pseudohypoxemia
The PaO2 may dramatically decrease if significant O2 is consumed in vitro after the blood is sampled—a problem that is most common with marked leukocytosis or thrombocytosis. Leukocyte counts higher than 105/mm3 or platelet counts higher than 106/mm3 usually are required to produce significant changes. Addition of cyanide or immediate icing of the blood sample decreases the likelihood of this
“pseudohypoxemia.” Diffusion of O2 through the wall of plastic syringes may lead to false reductions in measured PaO2 (particularly in samples with high O2 tensions) because plastic syringes are much more permeable than glass to oxygen.
“pseudohypoxemia.” Diffusion of O2 through the wall of plastic syringes may lead to false reductions in measured PaO2 (particularly in samples with high O2 tensions) because plastic syringes are much more permeable than glass to oxygen.
Pseudoacidosis
“Pseudoacidosis” may occur when metabolically active leukocytes generate large quantities of CO2, causing acidosis to develop in vitro. At room temperature, continued anaerobic glycolysis by red cells and white cells produces organic acids that can induce small reductions in pH and HCO concentrations.
concentrations.Air Bubbles
The PO2 of room air is approximately 150 mm Hg, and the PCO2 is near 0 mm Hg. Therefore, when large air bubbles are mixed with arterial blood, usually the PaO2 rises and the PaCO2 falls (if the PaO2 in the blood exceeds that in the bubble; however, the measured PaO2 could decline). A small air bubble in a relatively large sample usually has little effect, but when the ratio of bubble to blood volume is large, increases in PaO2 of up to 30 mm Hg may occur. It is uncommon for bubbles to significantly reduce the PaCO2 unless the baseline CO2 tension is very high.
Contamination of Arterial Samples with Venous Blood
Normally, the PaCO2 is higher and PaO2 is lower in venous blood than in arterial blood, as oxygen is extracted and carbon dioxide is added by metabolically active tissues. The degree of oxygen extraction varies greatly among organ systems. The heart is a near complete extractor of oxygen, whereas venous blood from the kidney contains large amounts of venous oxygen and less added CO2. Furthermore, the degree of O2 extraction can vary substantially over time for any specific organ. This heterogeneity of venous gas tensions explains why a peripheral venous sample, predominately reflecting skin and muscle oxygen extraction, cannot serve as an accurate indicator of total body oxygen extraction or consumption.
Arterial pH-Tissue pH
It is not always correct to assume that arterial pH reflects the pH at the tissue level. Discordance is a particular problem in patients with severe circulatory failure, in whom pulmonary blood flow is often substantially reduced. In this setting, blood that is delivered to the lungs may be adequately cleared of CO2, resulting in a relatively normal or even diminished arterial PCO2. However, the low cardiac output slows the return of CO2-containing blood from the periphery. As a result, the mixed venous PCO2, which represents blood that has not yet entered the pulmonary circulation, may be markedly higher than the PCO2 in arterial blood.
Risks
Risks of arterial puncture are very low for single sticks but increase with frequency of access and when persistent cannulation is used (see Chapter 2). Infection is very rare unless infected tissue is traversed en route to the artery. Arterial thrombosis can usually be avoided by varying sampling sites, using the smallest needle that produces good blood flow and confirming collateral flow before puncture (approx. 3% of hospitalized patients have inadequate collateral circulation). Even when all appropriate precautions are taken, ischemic complications can occur as a result of thrombosis, systemic hypotension, vasopressor use, or an underlying vascular disorder (e.g., Raynaud disease). Nerve trauma usually is because of direct nerve puncture by an inexperienced phlebotomist but also may result from a compressive hematoma if coagulopathy is present or if inadequate pressure is held at the puncture site.
▪ BASIC ABG CONCEPTS
Normally, arterial pH, the negative common logarithm of the hydrogen ion (H+) concentration, varies between 7.35 and 7.45. When breathing room air, normal PaCO2 varies between 35 and 45 mm Hg, and PaO2 values greater than 80 to 90 mm Hg are considered normal, depending on age. Mixed venous blood gases have a lower pH than arterial gases (normal, approx. 7.30 to 7.35), a lower PaO2 (normal, approx. 40 to 44 mm Hg), and a slightly increased PaCO2 (normal, approx. 45 mm Hg). Values for PaCO2, PaO2, and pH are measured directly. By contrast, the reported HCO concentration usually is not measured but rather is calculated from pH and PaCO2, using a nomogram derived from the Henderson-Hasselbalch equation. In similar fashion, the reported arterial oxygen saturation
(SaO2) usually is not measured but is calculated from the PaO2.
concentration usually is not measured but rather is calculated from pH and PaCO2, using a nomogram derived from the Henderson-Hasselbalch equation. In similar fashion, the reported arterial oxygen saturation (SaO2) usually is not measured but is calculated from the PaO2.
Alterations in Oxygenation
Oxygen Tension Versus Saturation
At ambient pressure, oxygen content of blood is determined predominantly by the quantity of O2 bound to hemoglobin (Hgb), with only a minor contribution from dissolved O2. The O2 carried in a volume of blood (mL/dL) is influenced by PaO2 (mm Hg), Hgb concentration (gm/dL), pH, and the characteristics of the Hgb itself: O2 content = 1.34 (Hgb)(%Sat) + (0.003)(PaO2). Normally, the quantity of dissolved oxygen is negligible, but it becomes significant when pure oxygen is administered under hyperbaric conditions. In such circumstances, PaO2 can exceed 2,000 mm Hg. ABG analysis determines the partial pressure of dissolved O2 directly but provides only an indirect (and often inaccurate) indicator of O2 content.
Hypoxemia
Tolerance for hypoxemia depends not only on the extent of desaturation but also on the compensatory mechanisms available and the sensitivity of the patient to hypoxia. If an individual without cardiac limitation or anemia is made hypoxic over a short period of time, no important effect will be noted until PaO2 falls below 50 to 60 mm Hg. At that level, malaise, light-headedness, mild nausea, vertigo, impaired judgment, and incoordination generally are the first symptoms noted, reflecting the high sensitivity of cerebral tissue to hypoxia. Although minute ventilation increases, little dyspnea usually develops unless the resulting hyperpnea uncovers underlying mechanical lung problems, as in chronic obstructive pulmonary disease (COPD). Confusion resembling alcohol intoxication appears as PaO2 falls into the range of 35 to 50 mm Hg, especially in older individuals with ischemic cerebrovascular disease (such patients also are prone to heart rhythm disturbances). As PaO2 falls below 35 mm Hg, renal blood flow decreases, urine output slows, and atropine-refractory bradycardia and conduction system blockade develop. Lactic acidosis also appears at this level, even with normal cardiac function. The patient becomes lethargic or obtunded, and hypoxic drive to breathe is maximal. At a PaO2 of approximately 25 mm Hg, the normal unadapted individual loses consciousness and minute ventilation begins to fall because of respiratory center depression. This sequence of events occurs at higher O2 tensions if any of the major compensatory mechanisms for hypoxemia are defective. Even mild decreases in O2 tension are tolerated poorly by anemic patients with impaired cardiac output or coronary insufficiency. Because the pulmonary vasculature constricts when alveolar O2 tension falls, hypoxemia may provoke decompensation of the right ventricle in patients with preexisting pulmonary hypertension or cor pulmonale.
Hyperoxia
At normal barometric pressures, venous and tissue O2 tensions rise very little when pure O2 is administered to healthy subjects. Hence, nonpulmonary tissues are little affected. However, high concentrations of O2 eventually replace nitrogen in the lung, even in poorly ventilated regions. Oxygen replacement of nitrogen eventually causes collapse of poorly ventilated units as O2 is absorbed by venous blood faster than it is replenished. Atelectasis and diminished lung compliance result. More importantly, high O2 tensions may accelerate the generation of reactive oxygen species and other noxious oxidants, injuring bronchial and parenchymal tissue. Although O2-induced lung injury certainly occurs in experimental models using healthy animals, the susceptibility of injured lungs to oxygen toxicity is much less certain.
Alterations in Ventilation
Hypercapnia
In addition to its key role in regulation of ventilation, the clinically important effects of CO2 relate to changes in cerebral blood flow, pH, and adrenergic tone. Hypercapnia dilates cerebral vessels and hypocapnia constricts them—a point of particular importance for patients with raised intracranial pressure. Acute increases in CO2 depress consciousness, probably a combined result of intraneuronal acidosis, excessive cerebral blood flow, and rising intracranial pressure. Slowly developing hypercapnia is better tolerated, presumably because buffering has time to occur. The adrenergic stimulation that accompanies acute hypercapnia causes cardiac output to rise and helps maintain peripheral vascular resistance. Muscular twitching, asterixis, and seizures can be observed at extreme levels of hypercapnia in patients made susceptible by electrolyte or neural disorders.
As a practical matter, for mechanically ventilated patients, many practitioners permit a modest respiratory acidosis (pH of 7.10 to 7.20) resulting from gradual increases in PaCO2 (<10 mm Hg/h) if the alternative is to markedly elevate airway pressures to achieve normocapnia. The practice of “permissive hypercapnia,” a consequence of using lower ventilating pressures and tidal volumes, has become widely accepted. Hypercapnia reduces tissue metabolism, improves surfactant function, and prevents nitration of proteins. Acidosis also decreases sarcoplasmic calcium release, dampens mitochondrial respiration, and reduces the activity of enzymes that produce inflammatory metabolic intermediates. These changes favor adequate cellular functioning, control of inflammatory response, improved cardiac function, and maintenance or reactivation of hypoxic pulmonary vasoconstriction, with resultant improvement ventilation/perfusion matching.
Hypocapnia
The major effects of acute hypocapnia relate to alkalosis and diminished cerebral perfusion. Abrupt lowering of PaCO2 reduces total cerebral blood flow, raises neuronal pH, and reduces available ionized calcium, causing disturbances in cortical and peripheral nerve function. Light-headedness, circumoral and fingertip paresthesias, and muscular tetany can result. Alkalosis caused by sudden reduction of PaCO2 (e.g., shortly after initiating mechanical ventilation) can produce life-threatening seizures or arrhythmias.
Evaluating Hydrogen Ion Concentration
Generation and Excretion of H+ Ion
Free H+ ions are present in the body fluids in extremely low concentrations. However, H+ ions are small and highly reactive, allowing them to bind more strongly than Na+ or K+ to negatively charged molecules. As a result, H+ concentration is critical to the activity of cellular enzymes. Under normal conditions, the H+ concentration varies little from the normal value of 40 nanoEq/L. The body buffers play an important role in this regulatory process, as they are able to take up or release H+ ions to prevent large changes in the H+ concentration. To keep H+ within physiologic limits, generation and elimination rates must be equal. H+ ion is generated in two ways:
By hydration of CO2 to form “volatile” acid according to the reaction:
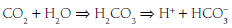
By production of “fixed” acids (primarily sulfates and phosphates) as chemical by-products of metabolism.
The kidneys and lungs play important roles in the maintenance of acid-base balance because they normally adjust the rate of acid excretion to meet homeostatic needs. Each day, approximately 15,000 mmol of CO2 produced by endogenous metabolism is excreted by the lungs. Similarly, a normal diet generates 50 to 100 mEq of H+ per day, derived mostly from the metabolism of sulfurcontaining amino acids and the subsequent generation of H2SO4. These H+ ions are initially buffered by HCO and by the cellular and bone buffers to minimize the fall in extracellular pH. Acid-base balance is then restored by urinary H+ excretion, which regenerates the HCO
 lost in the original buffering reaction. If the H+ concentration is increased, regardless of cause, it can be reduced toward normal by a decrease in the PCO2 and/or an elevation in the plasma HCO
 concentration. Both of these changes occur as alveolar ventilation and urinary excretion of H+ are enhanced in this setting. Conversely, alveolar ventilation and H+ secretion diminish when the concentration is reduced. The resultant increase in the PCO2 and decline in the plasma HCO
 concentration raise the H+ concentration toward normal. If the excretion rate of fixed acid speeds or slows disproportionately in relation to its production rate, or if abnormal metabolic loads of acid or alkali develop, metabolic acidosis or alkalosis occurs. In clinical practice, the concentration of free H+ ion is tracked by pH = -log [H+].
and by the cellular and bone buffers to minimize the fall in extracellular pH. Acid-base balance is then restored by urinary H+ excretion, which regenerates the HCO lost in the original buffering reaction. If the H+ concentration is increased, regardless of cause, it can be reduced toward normal by a decrease in the PCO2 and/or an elevation in the plasma HCO concentration. Both of these changes occur as alveolar ventilation and urinary excretion of H+ are enhanced in this setting. Conversely, alveolar ventilation and H+ secretion diminish when the concentration is reduced. The resultant increase in the PCO2 and decline in the plasma HCO concentration raise the H+ concentration toward normal. If the excretion rate of fixed acid speeds or slows disproportionately in relation to its production rate, or if abnormal metabolic loads of acid or alkali develop, metabolic acidosis or alkalosis occurs. In clinical practice, the concentration of free H+ ion is tracked by pH = -log [H+].Base Excess
The “base excess” is a calculated number that quantitates metabolic abnormality. It hypothetically “corrects” pH to 7.40 by first “adjusting” measured PaCO2 to 40 mm Hg, thus allowing a comparison of the “corrected” HCO with the known normal value at that pH (24 mEq/L). As a quick rule of thumb, base excess (mEq/L) can be calculated from the observed values for HCO
 and pH:
with the known normal value at that pH (24 mEq/L). As a quick rule of thumb, base excess (mEq/L) can be calculated from the observed values for HCO and pH:A “negative” base excess means that HCO stores are depleted. However, the base excess does not
indicate whether retention or depletion of HCO is pathologic or compensatory for long-standing respiratory derangements; that judgment must be made by an analysis of the clinical setting. Likewise, it does not dictate the need for bicarbonate administration. Calculation of base excess is especially helpful when the observed HCO
 is nearly normal (24 ± 3 mEq/L). The base excess calculation is unlikely to provide new insights at more extreme HCO
 deviations.
stores are depleted. However, the base excess does not indicate whether retention or depletion of HCO
is pathologic or compensatory for long-standing respiratory derangements; that judgment must be made by an analysis of the clinical setting. Likewise, it does not dictate the need for bicarbonate administration. Calculation of base excess is especially helpful when the observed HCO is nearly normal (24 ± 3 mEq/L). The base excess calculation is unlikely to provide new insights at more extreme HCO deviations.Buffer Systems
Carbonic Acid
Chemical and protein buffer systems oppose changes in free H+. The CO2/HCO (carbonic acid) and hemoglobin systems are quantitatively the most important. Clinical attention usually is focused on the carbonic acid system because each of its components is measured readily and because CO2 and HCO
 determinations allow clinical judgments to be made concerning the respiratory or metabolic origin of the problem at hand. To maintain pH at 7.40, the ratio of HCO
 to (0.03 × PaCO2) must remain in the 20:1 proportions dictated by the Henderson-Hasselbach equation:
(carbonic acid) and hemoglobin systems are quantitatively the most important. Clinical attention usually is focused on the carbonic acid system because each of its components is measured readily and because CO2 and HCO determinations allow clinical judgments to be made concerning the respiratory or metabolic origin of the problem at hand. To maintain pH at 7.40, the ratio of HCO to (0.03 × PaCO2) must remain in the 20:1 proportions dictated by the Henderson-Hasselbach equation:Noncarbonic (Protein) Buffers
Noncarbonic buffers may be intracellular or extracellular including proteins (albumin, hemoglobin), phosphates, and bone carbonates. On the average, 55% to 60% of an acid load will eventually be buffered by the cells and bone, although higher percentages may occur with severe acidemia when extracellular HCO stores are markedly reduced. Noncarbonic buffers bind or release H+ ions, minimizing pH changes while allowing the hydration reaction for CO2 to continue to run in either direction.
stores are markedly reduced. Noncarbonic buffers bind or release H+ ions, minimizing pH changes while allowing the hydration reaction for CO2 to continue to run in either direction.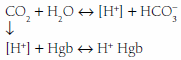
For this reason, if PaCO2 changes acutely, there will be a small associated change in HCO in the same direction (approx. 1 mEq/L per 0.1 pH unit). Such automatic changes in HCO
 do not imply a metabolic disturbance, and the “base excess” attributable to this mechanism is zero. Anemic blood fails to buffer fluctuations in H+ concentration with normal efficiency.
in the same direction (approx. 1 mEq/L per 0.1 pH unit). Such automatic changes in HCO do not imply a metabolic disturbance, and the “base excess” attributable to this mechanism is zero. Anemic blood fails to buffer fluctuations in H+ concentration with normal efficiency.Compensatory Mechanisms
As physiologic stresses on pH balance persist, adjustments in the excretion rate of CO2 and H+ counterbalance the effect of these disturbances on pH. In general, renal compensation for a respiratory disturbance is slower (but ultimately more successful) than respiratory compensation for a metabolic disturbance. Thus, although quick to respond initially, the respiratory system will not eliminate sufficient CO2 to completely offset any but the mildest metabolic acidosis. Furthermore, the respiratory compensatory response is not developed fully until 24 to 48 h after initial activation. The lower limit of sustained compensatory hypocapnia in a healthy adult is approximately 10 to 15 mm Hg. Once that limit is reached, even small additional increments in H+ ion have exaggerated effects on pH.
Patients with disordered lung mechanics, such as those with COPD or neuromuscular weakness, are highly vulnerable to metabolic acid loads because they lack the normal ability to compensate by hyperventilation. CO2 retention in response to alkalosis is very limited—only rarely exceeding 60 mm Hg. Moreover, the hypoxemia resulting from hypoventilation helps limit the rise in CO2 by eventually triggering increased ventilatory effort. Although the kidney cannot respond effectively to abrupt respiratory acidosis or alkalosis, renal compensation may eventually (3 to 7 days) totally counterbalance a respiratory alkalosis of even moderate severity. The kidney also compensates well for chronic respiratory acidosis but cannot compensate completely for a PaCO2 above 65 mm Hg unless another stimulus for HCO retention (e.g., volume depletion) is present.
retention (e.g., volume depletion) is present.Role of Electrolytes in Acid-Base Balance
According to the principle of maintained electroneutrality, the number of positive and negative charges in body fluids must be equal. Accordingly, serum cations (sodium + potassium + calcium + magnesium) must equal anions (chloride + bicarbonate + proteins + sulfate + phosphate + organic acid anions). The main cations are Na+, K+, Ca2+, and Mg2+, and the main anions are HCO , Cl–, proteins (albumin), and phosphates. The balance among these electrolytes influences acid-base status (see anion gap and Stewart Approach). In fact, evaluation of acid-base status is incomplete without consideration of the clinical setting and the electrolyte profile.
, Cl–, proteins (albumin), and phosphates. The balance among these electrolytes influences acid-base status (see anion gap and Stewart Approach). In fact, evaluation of acid-base status is incomplete without consideration of the clinical setting and the electrolyte profile.▪ ACID-BASE DERANGEMENTS
Terminology of Acid-Base Disorders
The terms acidemia and alkalemia refer to blood pH. Systemic pH lower than 7.35 defines acidemia. A pH higher than 7.45 defines alkalemia. By contrast, acidosis and alkalosis do not refer to pH but rather to basic pathophysiologic processes or tendencies favoring the development of acidemia or alkalemia. For example, a patient with diabetic ketoacidosis (DKA) (a primary metabolic acidosis) and hypocapnia stimulated by pneumonia (a primary respiratory alkalosis) may exhibit acidemia, alkalemia, or a normal pH depending on the relative changes in PaCO2 and HCO . Uncomplicated metabolic acidosis is characterized by a decline in HCO
 , whereas a primary increase in HCO
 denotes metabolic alkalosis. Conversely, respiratory acidosis is defined as a primary increase in PaCO2, whereas respiratory alkalosis occurs when the central feature is a decrease in PaCO2.
. Uncomplicated metabolic acidosis is characterized by a decline in HCO, whereas a primary increase in HCO denotes metabolic alkalosis. Conversely, respiratory acidosis is defined as a primary increase in PaCO2, whereas respiratory alkalosis occurs when the central feature is a decrease in PaCO2.Stepwise ABG Analysis
We can use one or both of the following approaches to characterize the acid-base status.
Henderson-Hasselbach Approach
Because no set of ABG values has a unique interpretation, concomitant analysis of serum electrolytes and the review of the clinical situation are essential to reach the correct diagnosis in an acid-base disorder. Three specific factors (pH, PaCO2, and the ratio of PaCO2 to HCO ) must be evaluated in a logical stepwise fashion. Interpretation of the pH and PaCO2 rapidly provides a definitive diagnosis in most cases. The remaining disorders can be classified by examining the relationship of the measured PaCO2 to the PaCO2 expected, based on the measured bicarbonate level. Consideration of the anion gap often lends supportive information.
) must be evaluated in a logical stepwise fashion. Interpretation of the pH and PaCO2 rapidly provides a definitive diagnosis in most cases. The remaining disorders can be classified by examining the relationship of the measured PaCO2 to the PaCO2 expected, based on the measured bicarbonate level. Consideration of the anion gap often lends supportive information.The pH is analyzed first. Values below the normal range indicate acidemia (elevated H+). A pH value above the normal range (reduced H+) defines alkalemia. A pH within the normal range has three possible interpretations: (i) no acid-base disorder exists; (ii) two or more acid-base disorders with perfectly offsetting pH effects exist (rare); or (iii) near-complete physiologic compensation has occurred for one or more primary disorders. Deviations of pH from normal usually are quickly acted on by compensatory mechanisms in an attempt to restore the pH to a normal value. When the primary disorder is respiratory, the kidney attempts to compensate. When metabolic consumption or wasting of BB is the primary problem, the lung attempts to return the pH to normal.
In the acidemic patient, an elevated PaCO2 indicates that some component of respiratory acidosis is present. In such patients, the bicarbonate concentration can be used to decide whether appropriate metabolic compensation is occurring or if a concurrent metabolic disorder is present. If the measured HCO concentration has increased over baseline by 0.10 to 0.35 unit for each 1-mm Hg change in PaCO2, appropriate metabolic compensation for a respiratory acidosis is taking place. Lesser increases in HCO
 are indicative of a complicating metabolic acidosis or suggest that insufficient time has elapsed for the kidney to compensate for the rapidly changing PaCO2. Greater rises in HCO
 indicate a superimposed metabolic alkalosis.
concentration has increased over baseline by 0.10 to 0.35 unit for each 1-mm Hg change in PaCO2, appropriate metabolic compensation for a respiratory acidosis is taking place. Lesser increases in HCO are indicative of a complicating metabolic acidosis or suggest that insufficient time has elapsed for the kidney to compensate for the rapidly changing PaCO2. Greater rises in HCO indicate a superimposed metabolic alkalosis.Conversely, a reduced PaCO2 in an acidemic patient indicates metabolic acidosis. In the case of a metabolic acidosis, the ultimate diagnosis is reached by comparing the observed PaCO2 to that predicted by directly measuring the serum HCO content. For any given HCO
 value, the expected PaCO2 = (1.5 × HCO
 ) + (8 ± 2). This equates to roughly a 1.0 to 1.3 mm Hg change in PaCO2 for each mEq change in bicarbonate. Typically, respiratory compensation for a metabolic acidosis is more rapid but less complete than the converse. If the observed PaCO2 equals the expected value, a simple metabolic acidosis with appropriate respiratory compensation is present. If the PaCO2 exceeds the expected value, the patient has both a respiratory and metabolic acidosis. When the observed PaCO2 fails to reach the expected level, the patient has both a metabolic acidosis and respiratory alkalosis.
content. For any given HCO value, the expected PaCO2 = (1.5 × HCO) + (8 ± 2). This equates to roughly a 1.0 to 1.3 mm Hg change in PaCO2 for each mEq change in bicarbonate. Typically, respiratory compensation for a metabolic acidosis is more rapid but less complete than the converse. If the observed PaCO2 equals the expected value, a simple metabolic acidosis with appropriate respiratory compensation is present. If the PaCO2 exceeds the expected value, the patient has both a respiratory and metabolic acidosis. When the observed PaCO2 fails to reach the expected level, the patient has both a metabolic acidosis and respiratory alkalosis.In the alkalemic patient, a low PaCO2 diagnoses respiratory alkalosis. Determination of whether the disorder is simple or mixed results from examining a concurrently measured HCO concentration. Reductions in HCO
 concentration of 0.2 to 0.5 times the change in PaCO2 will occur slowly to provide the compensation necessary. Failure to lower HCO
 by at least 0.2 times the change in PaCO2 suggests a superimposed metabolic alkalosis (or insufficient compensatory time), whereas a HCO
 that declines by more than 0.5 times the change in PaCO2 suggests a component of metabolic acidosis (Table 12-1).
concentration. Reductions in HCO concentration of 0.2 to 0.5 times the change in PaCO2 will occur slowly to provide the compensation necessary. Failure to lower HCO by at least 0.2 times the change in PaCO2 suggests a superimposed metabolic alkalosis (or insufficient compensatory time), whereas a HCO that declines by more than 0.5 times the change in PaCO2 suggests a component of metabolic acidosis (Table 12-1).Related posts:


Stay updated, free articles. Join our Telegram channel

Full access? Get Clinical Tree


