For the 21st century physician, epidemiology is the epistemology of medical knowledge.
 The utility and certainty of medical knowledge depends on the quality of the epidemiologic literature.
Disease Burden
 Disease burden in a population is commonly described as present or absent.
 Prevalence: at a specific point in time
 Number of people with disease / total number in population
 Incidence: over a time interval
 Number newly diagnosed with disease/total number at risk of disease during that time
 Disability-adjusted life years lost (alternatively quality-adjusted life years lost): a measure used to quantify the lost vitality attributable to disease, including when the disease is not fatal
 The method uses individuals’ preferences about health states, called “utilities,” to give greater value to healthier disease states.
Diagnosis
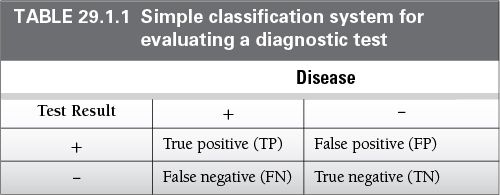
 Diagnostic tests guide the physician’s decision to determine if a patient has a disease or not (Table 29.1.1).
 Tests are typically evaluated in a diagnostic two-by-two table against a gold standard using the following metrics:
 Sensitivity: proportion of individuals with disease who have a positive test result. Hint: Be sensitive to people with disease
 Sensitivity = TP / (TP+FN)
 Specificity: proportion of individuals without the disease who have a negative test
 Specificity = TN / (TN+FP)
 Positive predictive value: proportion of individuals with a positive test who have the disease
 Positive predictive value = TP / (TP+FP)
 Negative predictive value: proportion of individuals with a positive test who have the disease
 Negative predictive value = TN / (TN+FN)
 Accuracy: proportion of individuals correctly classified by the test
 Accuracy = (TP+TN) / (TP+TN+FP+FN)
 Likelihood ratio for a negative test: the odds of having the disease given a negative test
 Negative likelihood ratio = [FN / (FN + TP)] / [TN / (TN+FP]
 Negative likelihood ratio = [1-sensitivity] / specificity
 Likelihood ratio for a positive test: the odds of having the disease given a positive test
 Positive likelihood ratio = [TP / (TP+FN)] / [FP/(FP+TN)]
 Positive likelihood ratio = sensitivity / (1-specificity)
 Limitations:
 These methods require binary classification of a test result using a cut-point.
 Many tests lack meaningful cut-points.
 These methods do not fully incorporate Bayesian methods such as pretest probabilities.
Measures of Association
 Describes the relationship between a risk factor and an outcome
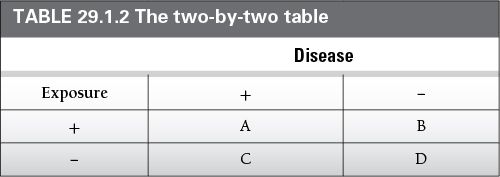
 Reported measures of association must include the direction, magnitude, and statistical significance (Table 29.1.2)
 Direction denotes whether the presence of a risk factor is associated with greater or lesser risk of disease
 Magnitude denotes the size of the association, which may be small, null, or large
 Statistical significance is a way to describe the certainty of an association
The Two-By-Two Table is a Convention for Describing the Distribution of Disease by Exposure Status
 Relative risk (risk ratio): The risk of disease in the exposed group relative to the risk of disease in the unexposed group
 In a cross-sectional study, this calculation is referred to as a prevalence ratio. The term hazard ratio is practically equivalent to relative risk.
 Relative Risk = risk of disease in exposed group/risk of disease in unexposed group
 Relative Risk = [A / (A +B)] / [C / (C+D)]
 Odds ratio
Stay updated, free articles. Join our Telegram channel

Full access? Get Clinical Tree


