Fig. 18.1
This Fig depicts the pressure volume curve of lung (P L ), chest wall (P CW ) and total respiratory system (P T ). The diagram indicates the direction and magnitude of the elastic forces of lung (blue line), chest wall (red line) and total respiratory system (black dashed line) at various lung volumes. At total lung capacity (TLC) the PCW is positive, trying to return to its resting state. The volume of lung and chest wall at zero pressure is different: lung has to be expanded and chest wall has to be compressed to reach resting volume. At resting volume (FRC), the inward elastic recoil of lung is equal to outward elastic recoil of chest wall. The residual volume is the lowest lung volume that the chest wall will allow to occur [2]
In summary, the lung has four basic lung volumes that constitute both inspiratory and expiratory phases and are as follows [2, 3, 4]:
- 1.
Inspiratory reserve volume (IRV)
- 2.
Tidal volume (Vt)
- 3.
Expiratory reserve volume (ERV)
- 4.
Residual volume (RV)
When two or more volumes are combined, they constitute four distinct lung capacities that are as follows [2, 3, 4]:
- 1.
VT + IRV = inspiratory capacity (IC)
- 2.
RV + ERV = functional residual capacity (FRC)
- 3.
VT + IRV + ERV = vital capacity (VC)
- 4.
IRV+ VT + ERV + RV = total lung capacity (TLC)
A typical spirometry tracing that displays the measured lung volumes is depicted in ◘ Fig. 18.2. Although the report will contain a large amount of numbers, the spirometry will only yield three values of interest for the anesthesiologist. The FVC (forced vital capacity), the FEV1 (forced expiratory volume in 1 s) and the ratio FEV1 to FVC. The absolute values are reported as percent of the predicted.
Fig. 18.2
a Depicts volume of air expired as a function of time in seconds with included examples of measured and expected values for FVC, FEV1, and FEV1/FVC ratio. b Flow volume curve obtained with spirometry with expiration above the x-axis and inspiration below x-axis (Reprinted with permission from Madsen et al. [31])
When interpreting a spirometry, the first thing to check is that the patient values entered are correct as this will affected the predicted values. The next value to read is the FEV1/FVC ratio, which is a marker of obstruction. If the value is below the lower limit of normal for the patient, then the patient has obstructive airway disease (eg, asthma, chronic obstructive pulmonary disease [COPD], tracheal stenosis) [5]. If there is obstruction, the next value to see is the FEV1. This will help gauge the degree of obstruction present. The lower the value the worse the obstructive physiology (in general, an FEV1 <50% predicted represents severe obstruction) [1]. The last value to see is the forced vital capacity (FVC). The FVC is subject to many influences (lung and chest wall elastance, pleura, airway resistance, patient effort, duration of effort). A reduction in FVC is interpreted as restriction (ie, the lung cannot expand as much), however, this can be due to decreased muscle strength, large abdomen displacing the diaphragm, pleural disease, spinal deformity, poorly compliant chest wall, or a poorly done test. A decreased FVC requires clinical correlation, and if further clarification is needed to confirm restriction, then performing lung volumes is the necessary next step. In the setting of severe airflow obstruction, the FVC may be reduced [1].
18.1.2 Lung Volumes
We obtain all the lung volumes and capacities to better identify the type of physiological derangement the patient has. There are 3 methods available: (1) the plethysmography (body box), (2) the helium dilution technique, and (3) the nitrogen washout [2, 3, 4]. These techniques are used to measure the FRC and TLC (as these cannot be measured by spirometry alone). Each technique has its details and caveats, which can be read in pulmonary physiology books. In brief, plethysmography is based on Boyle’s Law, which states that, under isothermal conditions, when a constant mass of gas is compressed or decompressed, the gas volume decreases or increases and gas pressure changes such that the product of volume and pressure at any given moment is constant [2, 4].
By placing the patient in a tightly enclosed box, we can measure the change in volume and pressure and calculate the FRC. The nitrogen washout and helium dilution rely on the volume of distribution of a known gas in order to determine FRC [5].
In the helium dilution technique, patients are attached to a spirometer that includes a known concentration of helium in a known volume. After several breaths the concentration of the helium is distributed over an increased volume (that includes the patient’s lung volume) and allowed to reach a new equilibrium. The final exhaled concentration can thus be measured and the FRC can be calculated based on the dilution of the gas [5].
Similarly, in the nitrogen washout technique the patient is attached to a spirometry and allowed to breathe in 100% FiO2 while measuring exhaled volumes and nitrogen concentration at timed intervals. With each breath the exhaled concentration of nitrogen is decreased until after several minutes (approximately 7 min) the entire concentration of the nitrogen in the lung has been washed out [5]. Once this happens FRC can be determined using a formula. A reduction on TLC below the lower limit of normal is consistent with restriction.
18.1.3 Diffusion Capacity
We measure the pulmonary diffusion capacity of carbon monoxide (DL,CO) to gain insight into gas exchange. CO is used due to its similarity to oxygen in both molecular weight and solubility coefficients. CO has an affinity for hemoglobin that is 210 greater than oxygen and thus able to maintain a very high pressure gradient across the alveolo-capillary interface as only the free unbound gas contributes to this gradient [6]. Therefore, in theory, the diffusion of CO would be a reflection of the alveolo-capillary interface itself (see later section in the chapter: Diffusion). The most common method for measuring DL,CO is by the single breath method. This test is done by having patients completely exhale to the level of RV followed by maximal inhalation of a gas mixture containing 0.3% CO to the level of the TLC [5]. The subject then holds their breath for 10 s followed by quick forceful exhalation. After the initial portion of gas is expired, which accounts for dead space, a sample of expired air is collected to calculate DL,CO [5]. It is measured in ml/min/mm Hg, using the volume of inhaled CO compared to exhaled volume of CO.
DL,CO is not only a manifestation of the alveolo-capillary interface, it depends upon a number of physiological factors (eg, age, sex, height, hemoglobin, lung volumes, carboxyhemoglobin, and exercise and body position). To account for these changes, it is often reported with corrections to the absolute value using hemoglobin DL,hb and lung volumes DL,VA.
18.1.4 Exercise Testing
In exercising healthy individuals, the supply of oxygen by the pulmonary system (minute ventilation) and the oxygen delivery by the cardiovascular system (cardiac output) are increased to provide oxygen to meet the demand of the skeletal muscle mitochondria. A cardiopulmonary exercise test is a physiological study that can identify defects in pulmonary ventilation, cardiovascular function, or skeletal muscle function. In complex patients, it can provide insight into the specific clinical limitations causing cardiopulmonary limitation. Exercise studies are also used to estimate preoperative morbidity and mortality in high-risk procedures [7].
Exercise testing is done with a metabolic cart connected via a non-rebreathing valve to a patient. The patient undergoes progressive exercise load over 10–15 min on either a stationary cycle or treadmill [5]. The metabolic cart measures the fractions of inspired and expired O2 and CO2, oxygen consumption (VO2), CO2 production (VCO2), and minute ventilation (Ve) [7, 8].
The VO2 is measured breath by breath during the exercise test. It reflects the amount of oxygen your body uses per kilogram per minute. In essence, it is the ability of a patient to deliver and use oxygen. Initially, during exercise VO2 increases linearly and is matched by linear increases in CO2 production, which reflects the increased skeletal muscle function [8]. The linear increase in VO2 continues until a maximum level is reached (VO2 max) and represents the patient’s aerobic capacity. If the patient continues to exercise after the VO2 max, it results in shifting of the skeletal muscle from aerobic to anaerobic metabolism. Anaerobic metabolism results in increased lactic acid, which is converted into lactate and CO2. The point where in theVCO2 is higher compared to VO2 is the anaerobic threshold (AT) [5].
VO2 max is usually lower in women compared to men and increases with exercise training. Impairment in aerobic function is defined as abnormally low VO2 max compared to predicted. A low VO2 max can be due to decreased cardiac output, decreased oxygen level, decreased hemoglobin, or muscle condition/function/size. The patterns of cardiac, pulmonary and muscle interaction help define the physiological defects. In addition to identifying exercise limitations, cardiopulmonary exercise testing can also be used to help gain insight in certain patient populations preoperatively. For example, a VO2max <15 ml/kg/min is associated with high-risk patients for thoracic surgery. An anaerobic threshold >11 ml/kg/min is associated with decreased perioperative mortality after surgery [7, 8]. As a consequence, several protocols include cardiopulmonary testing to assess candidacy for surgery (lung volume reduction, heart transplantation, and high-risk lung resections.
18.2 Lung Mechanics: Compliance and Resistance
The respiratory system can be characterized by two physiological characteristics: (1) compliance and (2) resistance. These terms are further defined below. The best way to understand the characteristics of respiratory systems in our opinion is by using the equation of motion (the equation has been simplified for clarity). This equation illustrates the forces and their interaction during breathing:

Where Pmus is the pressure generated by respiratory muscle activity and Pvent is the pressure difference across the respiratory system (ie, transrespiratory pressure = pressure at the airway opening minus pressure on the body surface) generated by a mechanical ventilator. Pressure, volume, and flow are variables (ie, change with time) while elastance and resistance are considered to be constant. The first evident conclusion is that the pressure from the respiratory muscles and/or the mechanical ventilator has to overcome the loads from the elastic component (elastance × volume) and the resistive component (resistance × flow) [3, 4].
(18.1)
18.2.1 Compliance
Elastance is the constant of proportionality between volume change and change in transrespiratory pressure (or the slope of the volume-pressure curve) [4, 5]. In practice it may be calculated as the change in pressure difference across the system divided by the change in lung volume (ie, tidal volume, VT) between two points in time when flow throughout the respiratory system is zero and Pmus = 0 (ie, the patient is paralyzed):
(18.2)
With this understanding, now we know that compliance describes the ability of change in pressure to distend the respiratory system and is expressed in mL/cmH2O. The respiratory system is not only comprised of lungs, it also includes the chest wall and abdomen. We need to recognize that a compliance obtained at the bedside includes this components [3, 9]. That is:
Where CRS is the respiratory system compliance, CL is the total lung compliance and CCW is the chest wall compliance. The compliance calculated by the ventilator is CRS. In order to ascertain CL and CCW we need to know the transmural pressures (pressures across the lungs and the chest wall). This means that we need to measure the pressure in the pleural space (or its surrogate, esophageal pressure) [9]. Hence the pressure across the lungs (transpulmonary pressure, PTP) is the pressure at the airway opening minus esophageal pressure and trans-chest wall pressure, PTCW, is esophageal pressure minus pressure on the body surface. Then CL and CCW are calculated by substituting PTP or PTCW into Eq. 18.3.
(18.4)
Lung Compliance
The factors responsible for lung compliance are the elastin and collagen fibers present in lung parenchyma and the alveolar surface tension [3, 6]. To better understand the elastic components we see a pressure/volume curve of the lung under different conditions. ◘ Figure 18.3 compares the compliance curve of a normal lung with compliance curve of lung with different pathology.
Fig. 18.3
This Fig compares the compliance curve of normal lung with various lung pathology. Note, that in emphysema and asthma the lungs are more compliant (ie, a small change in pressure causes a large change in volume) while in fibrosis and RDS (respiratory distress syndrome) the lung are less compliant (ie, a large in pressure is needed for small change in volume) (Reprinted with permission from Hildebrandt [32])
The curves labeled fibrosis and RDS (respiratory distress syndrome) represent low lung compliance (ie, a small change in volume for a large in change pressure). The curves labeled asthma and emphysema represent a lung with higher compliance (ie, a large change in volume for a small change in pressure) from loss of elastic tissues. ◘ Figures 18.3 and 18.4 highlight that the compliance of lung depends on the FRC from where the change in volume occurs. In ◘ Fig. 18.4 we can see that at the beginning or at the end of the inflation curve, minimal change in volume occurs with a large change in pressure. On the steeper part of the curve, a large change in volume occurs with less change in pressure. Clinically, this phenomenon is observed in patients with acute respiratory distress syndrome (ARDS) with too little positive end-expiratory pressure (PEEP) (under recruited) or very high PEEP (over distended). The other clinical condition is severe COPD, where the FRC is elevated due to air trapping and loss of elastic structures and is close to TLC, thus small changes in volume require high amounts of changes in pressure.
Surface Tension
The surface tension is a little bit counterintuitive and requires us to understand the Laplace law (◘ Fig. 18.5). Surface tension is the force present at the air-liquid interface caused by the attraction of the particles in the surface layer of a liquid, which tends to minimize the surface area [6, 11]. In other words, liquids have an inherent elastic tendency to acquire the least surface area possible (ie, a drop of water is circular in order to have the least surface area). The Laplace equation states that:

Where, P is the pressure within the alveoli (dyn/cm2), T is the surface tension inside the alveoli at air-liquid interface (dyn/cm), and r is the radius of the alveoli (cm).
(18.5)
Fig. 18.5
Depicts 2 alveoli (A and B) with different radius. If the pressure inside both alveolus is same, the surface tension changes with change in alveolar radius to maintain stability. In this case, surfactant will lower the surface tension in alveoli B, reducing the pressure inside and prevent it from collapsing (Reprinted with permission from Haitsma [34])
Following this formula, for a constant surface tension, smaller alveoli will have higher pressure. The high pressure in smaller alveoli will force it to empty itself in large alveoli and collapse (atelectasis) while larger alveoli with less pressure would have preferential ventilation. This phenomenon is not observed under normal conditions due to presence of pulmonary surfactant. The presence of pulmonary surfactant reduces the surface tension forces and results in lower pressure inside the alveoli [5, 6, 11]. Surfactant prevents atelectasis and allows even distribution of ventilation. The clinical correlate is ARDS in adults or RDS in premature neonates, where the absence of surfactant results in collapse of smaller alveoli and decreased total lung compliance.
The pulmonary surfactant is produced by type II pneumocytes and released by exocytosis in response to high-volume lung inflation, increased ventilation rate, or endocrine stimulation [6, 11]. It is composed of 90% lipid in the form of phospholipids with the remainder of it being protein and carbohydrates. Dipalmitoyl phosphatidyl choline is the main constituent. The hydrophobic fatty acids project into the gas phase, while the hydrophilic end lies in the alveolar lining fluid. The surfactant gets packed densely together during exhalation, when alveoli assume a smaller radius exerting a greater effect in reducing surface tension and preventing the alveoli from collapsing.
Hysteresis
The difference in shape between the inflation and deflation limbs of the pressure volume curve is called hysteresis (◘ Fig. 18.4). That is, there is a higher lung volume, per unit of pressure, at any given point during deflation compared to inflation. Hysteresis is mostly due to the presence of pulmonary surfactant and its effect on surface tension forces at the air-liquid interface. The other factor responsible for hysteresis is opening of closed alveoli during inspiration [2, 5]. These alveoli remain open during exhalation, explaining why more than the expected pressure is required during inflation. The loop becomes progressively broader as the tidal volume increases or, in ARDS, due to loss of surfactant.
Chest Wall Compliance
The chest wall is composed of visceral pleura, rib cage, muscle (including the diaphragm), fat, and skin. The abdominal cavity also contributes to the chest wall compliance; this becomes evident in conditions such as ascites, abdominal compartment syndrome, or obesity.
To measure the chest wall compliance, one needs to measure pleural pressure by placing a pleural catheter (rarely done, if ever) or using surrogate of pleural pressure (classically using an esophageal catheter) [9]. The gradient between the pressure at the airway opening and the pleural pressure will provide the transpulmonary pressure, which is a reflection of the lung compliance. The chest wall compliance then will be the total respiratory system compliance minus the lung compliance. The contribution of the chest wall to the respiratory system compliance ranges from 20% to 50% in normal to severe ARDS patients. Normal chest wall compliance is 200 ml/cm H2O.
Static and Dynamic Compliance
Static compliance is measured in absence of any air flow in the entire respiratory system with no muscle activity (muscle paralysis). Because, in some conditions we can only hold it for a few seconds before we have to let the subject breathe, the system never reaches true static condition and thus is called quasi-static compliance. There are different methods to measure compliance [10]:
The Super Syringe: In this method, a known amounts of gas (volume) is pushed into the lungs, and the pressure change is measured after flow has stopped. This is mainly used when trying to build a pressure volume curve. Another alternative is to use a very slow flow to increase the volume gradually while measuring the pressure change. Because the flow is low (<9 L/min), the resistive component is essentially eliminated.
Single Occlusion Test: This is the most commonly used method at the bedside. An end inspiratory pause is performed in patients receiving mechanical ventilation. The pressure will decay to form a plateau, commonly known as plateau pressure (Pplat).
Multiple Occlusion Test: Airway occlusions are performed several times at different points of expiration. This allows the building of a volume/pressure curve.
Dynamic compliance is measured during an active breath, but the changes in volume and pressure are measured between points in time when flow at the airway opening is zero. This can be done by hand, but a ventilator uses linear regression. Because there may still be flow among lung units even when flow at the airway is zero (ie, pendelluft) the pressure difference may be larger than under true static conditions [3, 10]. Hence dynamic compliance tends to be lower than static compliance to the degree that the mechanical properties in the lungs are heterogeneous.
18.2.2 Resistance
Resistance opposes the flow of gas in and out the respiratory system. Resistance is defined as the constant of proportionality between pressure (P) and flow ( ) in a flow conducting system and is usually expressed in units of cm H2O/ (L/s) [3, 5]:

) in a flow conducting system and is usually expressed in units of cm H2O/ (L/s) [3, 5]:The total respiratory system resistance is the result of airway (natural and artificial) and tissue resistance [3, 12]. The lung parenchyma and chest wall viscoelastic resistance to motion gives rise to tissue resistance. The contribution is minuscule and in clinical practice they are essentially ignored. Thus this section focuses on airway resistance.
The airway caliber, nature of the gas flow, viscosity, and density of the gas determine airway resistance. Under normal conditions, the most decisive of them is airway caliber [3, 5]. Poiseuille’s equation illustrates the relationship between airway caliber, laminar flow and viscosity:

Where, ∆(Delta) P is the pressure gradient across the flow path (airway), L is the length of the flow path, μ is a dynamic’s viscosity,  is the flow, r is a radius, and π(pi) is a mathematical constant. This equation demonstrates that the pressure gradient is directly proportional to gas flow. Because of this, for any flow rate, the pressure gradient divided by the flow rate equals a constant, called resistance:
(18.6)
is the flow, r is a radius, and π(pi) is a mathematical constant. This equation demonstrates that the pressure gradient is directly proportional to gas flow. Because of this, for any flow rate, the pressure gradient divided by the flow rate equals a constant, called resistance:(18.7)
The equation can be rewritten to show the factors affecting resistance:
(18.8)
Airway Caliber
The Poiseuille’s equation demonstrates that the major determinant of resistance is the airway radius. In normal subjects, the larger airway contributes to 80% of total airway resistance, while the rest stems from the smaller airways [2, 4, 6]. Although this seems counterintuitive (because the radius of the airway is the main contributor to resistance), the increase in cross-sectional area as the airways divide (bronchial subdivisions) compensates for the small diameter, such that because of the increased cross-sectional area of the distal airway, the resistance to flow as a matter of fact is reduced [3]. In conditions such as airway edema, obstructive lung disease, or secretions where there is a decrease in airway radius, the airway resistance exponentially increases and so does the workload on respiratory muscles.
The airway caliber is also dependent on lung volume. Resistance is inversely proportional to lung volume. As lung volume decreases, there is a decrease in airway volume and thus in transmural pressure. This can result in closure of smaller airway and increased airway resistance [2, 3]. During forced expiration, high intrathoracic pressures can exceed the transmural pressure resulting in their collapse and increased resistance. The larger airway, due to presence of cartilage, has higher structural integrity and is less prone to collapse by changes in lung volume.
The airway caliber is mainly regulated by the autonomic system innervating the smooth muscle in the bronchus. The parasympathetic nervous system innervates via vagal nerve and plays a critical role in maintaining the airway caliber. The afferent fibers in the bronchial epithelium are stimulated by noxious stimuli and cytokines [5, 6]. These stimuli cause the efferent fibers to release acetylcholine, which acts on muscarinic receptors (M3) leading to bronchoconstriction. As a counterbalancing measure, there are ß(beta)2 receptors in bronchial epithelium that are responsive to circulating catecholamine. The activation of ß(beta)2 receptors causes bronchodilation as seen during stress, exercise, and with drugs.
Density, Viscosity, and Turbulent Flow
The other contributors to resistance, as demonstrated by the Poiseuille’s equation, are the characteristics of the gas (density and viscosity) and the nature of the flow (turbulent vs. laminar). From the equation one can note that resistance, during laminar flow, is directly proportional to gas viscosity. Thus, helium (a low density, high viscosity gas) will not improve gas flow in conditions of laminar flow. However, in a condition where there is turbulent flow (ie, asthma or upper airway obstruction), helium does improve flow [5, 13]. This described by the Reynolds number (dimensionless unit):
Where, ρ(rho) is the density of the gas, d is the diameter of the tube, v us the linear velocity of the gas, and η(eta) is the viscosity. It is known that turbulent flow occurs when the Reynolds number is greater than 2000. At that point, the pressure gradient to generate flow is proportional to the gas density but independent of viscosity. As a consequence, helium (low-density gas) improves flow in asthma or airway stenosis.
(18.9)
In laminar flow, the gas flows in an orderly fashion as a series of concentric cylinders, which slide over each other forming the shape of a cone as they advance (◘ Fig. 18.6). The peripheral column of air in contact with wall is stationary while the center column of air slides over them. This greatly reduces the frictional forces acting on the airflow and hence the airway resistance is least with laminar flow. As can be seen from the diagram of laminar flow (◘ Fig. 18.6a), the center column of air will reach alveoli faster. During turbulent flow, the gas flows in a chaotic pattern with a square front (◘ Fig. 18.6b). This increases frictional forces acting on the flow and hence the resistance.
Fig. 18.6
a Shows a laminar flow with convex front. The arrows denote the direction and magnitude of air flow. b Turbulent flow with a square front (Reprinted with permission from Chatterjee and Fisher [35])
Measurement
In clinical practice, estimation of total respiratory system resistance (including the artificial airway) is often done during mechanical ventilation while delivering volume-controlled breath (at constant flow) with an end inspiratory pause (see ◘ Fig. 18.7). In light of Eq. 18.7 we can rearrange Eq. 18.1 to get:

The pressure gradient, ΔP vent is the peak pressure minus the plateau pressure. The flow gradient,  , is the set constant inspiratory flow relative to flow during the pause (ie, zero). The peak airway pressure constitutes both the elastic and resistive component. After occlusion there is a sharp drop in peak pressure followed by slow decline until it reaches plateau pressure. The plateau pressure constitutes the elastic component (as there is no flow). Thus ΔP vent is the pressure required to overcome the resistance at the set flow.
(18.10)
, is the set constant inspiratory flow relative to flow during the pause (ie, zero). The peak airway pressure constitutes both the elastic and resistive component. After occlusion there is a sharp drop in peak pressure followed by slow decline until it reaches plateau pressure. The plateau pressure constitutes the elastic component (as there is no flow). Thus ΔP vent is the pressure required to overcome the resistance at the set flow.Fig. 18.7
The pressure time curve on constant flow with end inspiratory pause. The ∆(Delta)pressure between the peak and plateau pressure, is the pressure required to overcome the resistive load, while the ∆(Delta)pressure between plateau and PEEP is pressure required to overcome the elastic load (Reprinted with permission from Rimensberger [36])
18.2.3 Work of Breathing
Work of breathing is the external work (diaphragm or ventilator) required to move air in and out of lungs by overcoming the elastic and resistive forces opposing it (◘ Fig. 18.8). Under normal conditions, the work of breathing is completely performed by the respiratory muscles. During respiratory failure, when respiratory muscles are unable to meet the demands, this work is partially or completely accomplished by the use of invasive or non-invasive mechanical ventilation.
Fig. 18.8
a In normal subjects inspiration starts from the relaxation volume of the respiratory system, where the passive pressure-volume curves of the lung [Pel(L)] and chest wall [Pel(cw)] intersect. Inspiratory muscle action results in pressure development (Pinsp) on the left of the pressure-volume curve of the chest wall [Pel(cw)]. Inspiratory flow, and thus increases in volume (VL) take place on the left of the pressure-volume curve of lung and coincide with the beginning of inspiratory muscle action. Inspiration ends on the pressure-volume curve of the lung and the inspiratory muscles relax (so that pressure returns on the pressure-volume curve of the chest wall). In the case shown, expiration is active so that pressure develops on the right of the pressure-volume curve of the chest wall due to activity of expiratory muscles (Pexp). This returns volume back to the relaxation volume of the respiratory system. b In COPD patients with dynamic hyperinflation, inspiration starts from an increased end-expiratory lung volume. Inspiratory muscle action has to overcome the intrinsic positive end expiratory pressure [PEEPi, red dashed line, horizontal distance between the Pel(L) and Pel(cw)] before it results in inspiratory flow and thus increases in volume. In mechanically ventilated patients, inspiratory muscle action has to overcome PEEPi plus the trigger sensitivity (Ptr) before it results in inspiratory flow and thus increases in volume (VL). When the magnitude of inspiratory muscle action is less than the sum of PEEPi + Ptr this inspiratory effort (orange line) cannot trigger the ventilator and consequently does not result in inspiratory flow and thus increases in volume (VL ). This inspiratory effort is called ineffective or wasted (Reprinted with permission from Vassilakopoulos [37])
Work occurs when force acting on an object causes displacement of the object in direction of force:
(18.11)
Pressure is the force acting on a unit area of an object and volume is the product of area and distance. They can be expressed as:
(18.12)
(18.13)
Rearranging the equation:

Hence, work occurs when a change in pressure causes a change in volume and can be calculated from the pressure volume curve:
∫PdV = Integral of applied pressure over a change in volume.
(18.14)
(18.15)
If you observe, the resting volume of lung and chest wall (ie, the volume at zero pressure) is different for lung and chest wall (◘ Fig. 18.8). The resting volume for lung is just above the residual volume. Hence, work is done to increase the lung volume to FRC. While the resting volume of the chest wall is above the FRC, the chest has to compress to FRC. This work done on chest wall is stored as kinetic energy and utilized during normal tidal breathing [3, 14].
When the lung compliance is decreased (eg, ARDS, pulmonary edema), the lung elastance curve is shifted to the left, requiring increased work of breathing. The increased work of breathing observed in obstructive lung disease is due to increased resistive component (ie, diagonally hatched area) [3, 14].
The work of breathing can also be expressed as O2 cost of breathing, which is the amount of oxygen consumed by the diaphragm and respiratory muscle during ventilation. The O2 cost of breathing in normal individuals is 0.5–1.0 mL of O2 per liter of ventilation, which is less than 5% of the total body oxygen consumption. During increased respiratory demand, the oxygen consumption by respiratory muscle can exceed 30% of the total body oxygen consumption.
18.3 Ventilation Perfusion
The primary function of respiratory system is exchange of oxygen and carbon dioxide. This depends on the gas inhaled and perfusion of the lungs. The ventilation and perfusion are not equally distributed throughout the lung normally, giving rise to a mismatch (V/Q = 0.8).
18.3.1 Ventilation
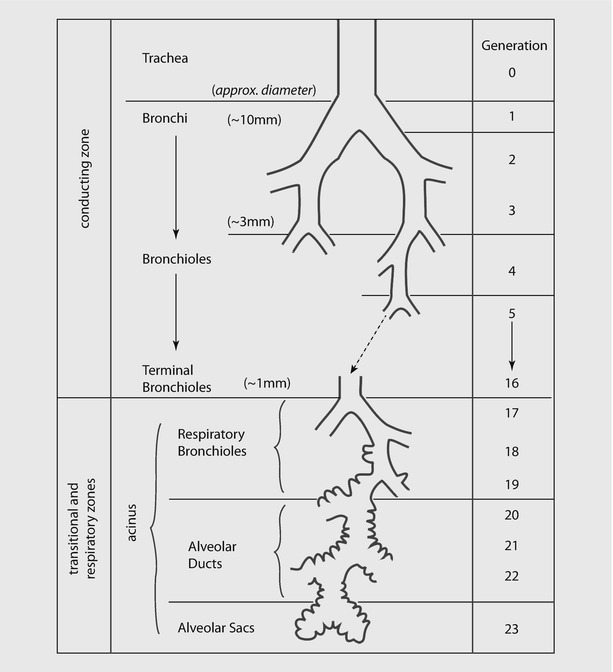
Ventilation involves convective movement of gas from the atmosphere into alveoli through the airways. Airways are divided into two zones (see ◘ Fig. 18.9):
- 1.
Conducting zone, where there is no exchange of gas. It includes mouth, nose, trachea and bronchi up to the terminal bronchioles.
- 2.
Respiratory zone, where the airway participates in gas exchange. It includes the respiratory bronchioles, alveolar sacs, alveolar ducts, and alveoli.
Fig. 18.9
Schematic representation of airway branching in adult human lung. Note that the airway branches a total of 21–25 times from trachea to alveoli. The exchange of gases occur in respiratory bronchioles and alveoli (Reprinted with permission from Tu et al. [38])
Minute Ventilation
Minute ventilation is amount of air entering the respiratory tree in a minute and is calculated as a product of respiratory rate (RR) and tidal volume (V T). In literature and most mechanical ventilators, usually the exhaled minute ventilation is reported:
(18.16)
For a healthy adult breathing 10 breaths/min and having a V T of 500 mL:
(18.17)
A fraction of gas remains in the conducting airways and will not participate in gas exchange. The fraction of V T that participates in gas exchange is called “alveolar volume.” The fraction of wasted breath in the conducting airway is called “dead space volume,” and it is estimated as 2 mL/kg of ideal body weight. Thus: